MIKROTIK DUDE BASIC INSTALLATION GUIDE, yes only basic 🙂 ~ Article by Syed Jahanzaib ~CNMS - Centralized Network Monitoring & Management System !!! - JZ

Example MAP of my Office LAN
NOTE: Be careful, Dude on router has a big impact on the router CPU resources. It is best to use it on a separate windows base system for more customized control.
What is THE DUDE ?
Answer is below > As Mikrotik Wiki defines:
The Dude is a free Monitoring application by MikroTik, which can dramatically improve the way you manage/monitor your network environment.
It will automatically scan all devices within specified subnets, Draw and Layout a map of your networks, monitor services of your devices and execute actions based on device state changes.
Some customized probes used in this map:
- Voice / Speak Alert on various target / devices down/up events
- NOC Room temperature (It alerts when temperature goes above 25)
- Vmware ESXi 4.0/5.0 Guest VM + windows/linux servers Power ON/Shutdown from Dude using Tool Menu with customized scripts *
- UPS Load / Voltages / UPS Internal Temperature
- IBM Lotus Number of Mail Waiting / DB Connected Users / Availability Index
- HP Printers Toner Remaining in %
- No. of Connected Users on each A.P
- Disk Free/Total Statics, Alerts when Specified partition goes above 90%
- Disk Read/Write Monitoring / Alert
- High Memory Monitoring Alert
- Windows Service Monitor on SAP Servers
- Cisco ASA / Switches CPU Load/ Up-time / Temperature
- Cisco Access Point Active Connected Users
- Alerts for Lotus Domino / SAP Servrs Service alert , for example if server is on but specific service is down
- Wireless Link Usage Monitoring
- Internet / LAN Link Monitor, If the link is in full utilization i.e 4mb, the link color changes to Orange, indicating Load on the link. very useful to monitor load.
Mikrotik’s “The DUDE” LIVE Monitoring System , It shows Live View of all devices and server’s on screen, Auto Refreshes at defined intervals,
GREEN icon shows target is Active & Healthy,
ORANGE shows one or more probes failed to poll query any specific counter/oid,
RED means the target device is not reachable via network or powered off.
With some my of my Customized Advance Monitoring Probes Like UPS Temperature, KESC Voltages IN , NOC Room Temperature, HDD Monitor, I have also made some Custom Alerts, For Example if NOC Room Temperature Goes above 25 Degree, It will show Visual Alert, Email or SMS. or if D: drive space on mail server goes above 80% it will alert me, If a targeted service on specific server stop, it visually alerts. Voice Speak Alert for various counters.
Very good and advance Monitoring System, It can Shutdown and POWER ON any system on MAP using tools and custom scripts, Also I have added some customize tools/scripts to run on target device using custom command , added in tool menu.
We call it CNMS, Centralized Network Monitoring System
Thanks to DUDE ![]()
You can Install the DUDE on your Windows PC , OR you can also install it on your Mikrotik x86/RouterBoard.
First Download ‘The Dude’ from
http://www.mikrotik.com/thedude.phpDownload the ‘Dude 4.0 beta 3′ for Windows
<a href="https://drive.google.com/drive/folders/0B8B_P2ljEc2xeHVYRVIxQWx6UTg">https://drive.google.com/drive/folders/0B8B_P2ljEc2xeHVYRVIxQWx6UTghttp://download.mikrotik.com/dude-install-3.6.exe</a>After download simply execute the .exe file and it will install it just like any other simple application.If you have install it on PC, you can start by going to START / Programs / The due.
Once installation is done, You can start by going to START / Programs / The due
Ok execute the dude. You will be asked for the credentials, Just like Mikrotik default installation, dude have no default password
- ID = admin
- Password = No Password, Just Enter

Now you will The Dude main screen. Just for an example, I will add simple Network by using Auto DISCOVERY. You can later create your own desired network MAP once you understand HOW things works in dude.

Use your local subnet series. Also click on ‘LAYOUT MAP AFTER DISCOVERY COMPLETE’.
Remove un-necessary services from SERVICES menu, so you will not get red icon if the services not found.
Its best to install SNMP on all of your servers to get the maximum information like Link usage/CPU/Memory/HDD etc etc.

After it will completes the discovery, it will create a automatic layout map, Something similar to below image.

If you are unable to see any PC , Try adding few ips manually. If target pc ping/icmp is blocked, then you won’t be able to see any PC in the graphs, so its better to use another approach /combination on “Device name preferences”. Also check your mikrotik / target pc firewall configuration.
The above image looks Pretty much messed up, but you can trim it or adjust it according to your flavor :), like the below

The DUDE tip’s n tricks 🙂
Howto ADD Machines/Devices Manually (Without Auto Discovery Mode)
Sometimes You would like to add only few targeted devices / computers on your network to be monitored via dude.
To do so follow the instructions showed in the below screenshots.
On the Network MAP screen, Click on + sign, then select Device. Now enter IP address of your target device and click NEXT.

Now select DISCOVER to check what services target device is offering for monitoring.

Now add another device as shown in above images.
Now add Network ICON so that we can connect both devices for link monitoring.

Now the real part, Again Click on + sign and click LINK to create link between device and network icon.


Howto Change Background Image
You can change background image by going to

HOWTO ENABLE WEB BASE ACCESS
You can also View/Controll Dude via web browser. This is convenient if you have fix public ip on your mikrotik / pc where due is hosted, you can monitor your network all over globe using browser only.
First you have to enable Web Service in DUDE.

Make sure there is no other web server running on your pc/mikrotik. If so, please change the port in above image to something different , example 1234. Now open your browser and point it to your dude server.
[sourcode]
[/sourcecode]
It will ask id password, Enter your credentials. (First time dude installation have no password, just enter use admin without any password, and then you can change password from ADMIN section.
Now click on MAPS > Network Map & you will be redirected to your network map. See the below image.


HOWTO Show Link Capacity with color changing on full usage
If you want to monitor link bandwidth usage, and you want to configure that if the link is used fully its color should be changed as showed in the image below . . .

.
take properties of link , and tick on ‘speed’ and define the value you want to monitor. for example 1mb
as showed in the image below.

HOWTO Show any OID on Device
Some of the examples are taken from the Mikrotik DUDE forum.
Special thanks to Mr. Lebowski
Right click on your device and select APPEARANCE, click on LABEL: and add this OID (For example only, change the OID as your requirement)
NOC Room Temperature : [oid("1.3.6.1.4.1.534.1.6.5.0")]OR
if you want to divide the value to be displayed, use following formula
Temperature: [oid("1.3.6.1.4.1.13400.2.62.2.1.2.0")/100]
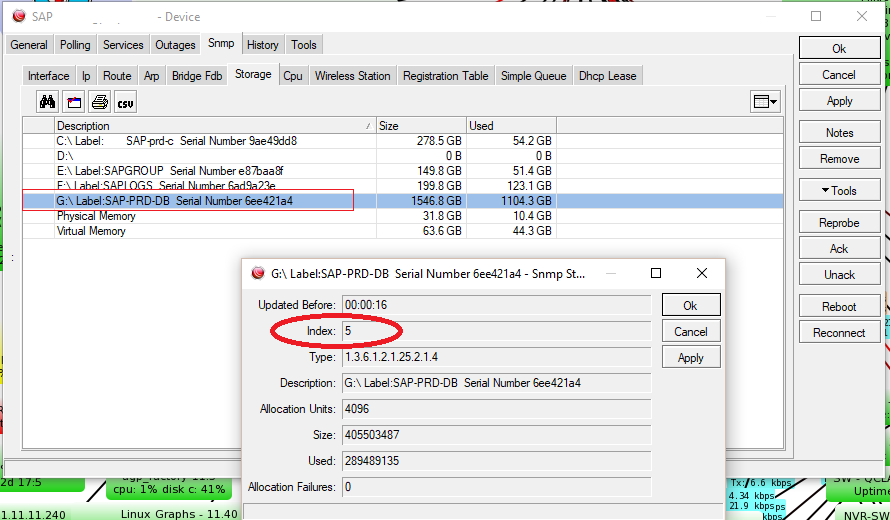
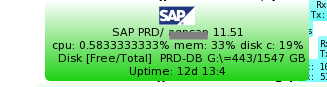
Show Windows Disk Space on Label
To display Disk space on LABEL, first look for that particular partition OID, & then change it in below code, (my G: drive partition OID is 5, your’s may vary)
TIP:
Then use the below code on LABEL, (Right click on your dude target, and take APPEARANCE option and paste the code in LABEL section]
[Device.Name] [device_performance()][Device.ServicesDown] Disk [Free/Total] G:\=[round(((((oid("1.3.6.1.2.1.25.2.3.1.5.5")-oid("1.3.6.1.2.1.25.2.3.1.6.5"))*oid("1.3.6.1.2.1.25.2.3.1.4.5"))/1024)/1024)/1024)]/[round(((oid("1.3.6.1.2.1.25.2.3.1.5.5")*oid("1.3.6.1.2.1.25.2.3.1.4.5")/1024)/1024)/1024)] GB Uptime: [string_substring(oid("1.3.6.1.2.1.1.3.0"),0,8)]
MIKROTIK OIDS FOR DISPLAY
[Device.Name] Uptime: [string_substring(oid("1.3.6.1.2.1.1.3.0"),0,8)] [device_performance()][Device.ServicesDown] Active PPP users: [oid("1.3.6.1.4.1.9.9.150.1.1.1.0")] Voltage: [oid("1.3.6.1.4.1.14988.1.1.3.8.0")/10] V / Temperature: [oid("1.3.6.1.4.1.14988.1.1.3.10.0")/10] C Processor-Temp: [oid("1.3.6.1.4.1.14988.1.1.3.11.0")/10] C Power-Consumption: [oid("1.3.6.1.4.1.14988.1.1.3.12.0")/10] WResult:
HOWTO Remote Shutdown any PC using DUDE Tools (generally for AD environment)
Open Dude console, from left menu, goto tools, and click on plus sign + to add new tool,the following
Type: Executable Name: Shutdown Target: c:\windows\system32\shutdown.exe -s -f -t 30 /m \\[Device.FirstAddress]I will add more snaps and info of some live networks where I deployed this beautiful tool.
One Link:
https://aacable.wordpress.com/2012/07/02/the-dude-show-us-your-map-series/
HOWTO add probe for disk like C: & D:
To monitor C: or D: drive for space alert, First create Function, then create probe and use the function. then add this probe to device 🙂
Function. Name: drivec Code :if(array_size(oid_column(1.3.6.1.2.1.25.2.3.1.6,10,5)),round((oid(1.3.6.1.2.1.25.2.3.1.6.1,10,5)/oid(1.3.6.1.2.1.25.2.3.1.5.1,10,5))*100),False)Now create new Probe.
Name:Low Space in C Drive Type: Function Available:drivec()False Error:if(drivec()False,if(drivec() < 85, , concatenate(Warning: Drive C = , drivec(), %)), Failed to read Drive C the server might be down) Value:drivec() Unit: %Now add this probe in target windows device in service section. That’s it. Now if the C: Drive goes above 85%, it will alert, you can tag voice/visual/email/sms alert with it. I use VOICE alert 😀
NOTE: The OID for the C: drive can be different on your system , it depends on the drives you have in your system, for example I used the 1.3.6.1.2.1.25.2.3.1.6.1 , but you may have 1.3.6.1.2.1.25.2.3.1.6.2 , so its better to check it in snmp section of device properties.
HOWTO show Disk Read & Write Time
You have to first install snmptools and add disk counters in the ini file in order to retrieve the disk read write time counters.e.g: https://aacable.wordpress.com/2012/07/25/using-snmptools-to-monitor-disk-read-write-time-win2008-6432-bit/
Disk Read / Write Time C: & D: [string_substring(oid(“1.3.6.1.4.1.15.1”),0,3)] / [string_substring(oid(“1.3.6.1.4.1.15.2”),0,3)]
HOWTO check if specific program is running or not [using taskmgr list]
Create New FUNCTION and tag it with your required target device.
Probe Name: lotus_notes_test Type: Function Available: if(array_find(oid_column("1.3.6.1.2.1.25.4.2.1.2"), "nserver.exe")>0, 1, -1) Error: if(array_find(oid_column("1.3.6.1.2.1.25.4.2.1.2"), "nserver.exe")>0, "", "Domino Service not Running") Value: 1 Unit: runningNote: Replace notes2.exe with your require file’s name you want to monitor. The name is case-sensitive! Write the full file name the same as you see it in the Windows Task Manager List.
HOWTO check if specific SERVICE is running or not
Create New Probe and tag it with your required target device.
Probe Name: check_telnet_service Type: Function Available: if(array_find(oid_column("1.3.6.1.4.1.77.1.2.3.1.1"),"Telnet")0, 1, 0) Error: if(array_find(oid_column("1.3.6.1.4.1.77.1.2.3.1.1"),"Telnet")0, "", "Telnet not detected by SNMP probe") Value: 1 Unit:Note: Replace Telnet with the service name your want to monitor. Type the full name of the service you see in the services console. The name may be case-sensitive! Write the file name the same as you see it in the Services Console.
HOWTO Create Alert if specific OID result gets below Specific Digit/% like NOC room temperature
If you want to monitor specific OID result and if it gets below or above your pre-defined number, it should alert, Use the below probe (I used this probe to monitor my data center room temperature using temperature device, if the temperature goes above 25, it alerts using sms/voice alert)
Name: NOC Room Temperature Alert Type: Function Available: if(oid("1.3.6.1.4.1.534.1.6.5.0")0, 1, -1) Available: if(oid("1.3.6.1.4.1.534.1.6.5.0")25, "", "NOC Room Temp Over 25 / SJz") Value: 1.3.6.1.4.1.534.1.6.5.0 Unit: Cand if you want to divide the snmp result by 100 , then you have to first create function like following.
then create a probe with following data.
Name: NOC Room Temp Type Function: Agent: Default Available: getTemperature() Error: if(getTemperature()<25, "", "NOC Room Temperature above 25 c, Please check A.C") Value: getTemperature() Unit: C
HOWTO show ping result on device label
If you want to show the ping result on your device label, Right click on device , select appearance, in Lablel, paste the following code:
[array_element(ping(device_property(“FirstAddress”)),0)] ms
HOWTO Check for High Delay via Ping Function/Probe
If you want to monitor any device ping delay ms, for example if ping ms delay to any internet link increases above 600 ms , then it should alert, use the following function/probe.
First add new function
Function: Name: ping_rtt Description: Returns the round-trip time of a ping request to the FirstAddres of a device Code: round(array_element(ping(device_property("FirstAddress")), 0))Now create probe and tag the ping_rtt function in it.
Probe Name: Ping Delay Type: Function Available: and(device_property("FirstAddress") "", ping_rtt()>-1) Error: if(and(ping_rtt()>-1, ping_rtt()-1, concatenate("Latency above 200ms with ", ping_rtt(), "ms"), "down")) Value: ping_rtt() Unit: msNow tag it with the device in services section.
HOWTO check HP 2420n Toner Cartridge
On device label, use the following oid [Make sure you have enabled the snmp on the printer and in the device snmp section)
TONER [oid("1.3.6.1.2.1.43.11.1.1.9.1.1")/0.6000*100] % Remaining
HOWTO show number of connected users on Cisco AP
Active WiFi Users: [oid("1.3.6.1.4.1.9.9.273.1.1.2.1.1.1")]
HOWTO show number of PPP ACTIVE users on Mikrotik RouterOS
Active PPP Users: [oid("1.3.6.1.4.1.9.9.150.1.1.1.0")]
HOWTO show Disk C: & D: Free/Total statistics on Device Lable
Disk [Free/Total] C:\=[round(((((oid("1.3.6.1.2.1.25.2.3.1.5.1")-oid("1.3.6.1.2.1.25.2.3.1.6.1"))*oid("1.3.6.1.2.1.25.2.3.1.4.1"))/1024)/1024)/1024)]/[round(((oid("1.3.6.1.2.1.25.2.3.1.5.1")*oid("1.3.6.1.2.1.25.2.3.1.4.1")/1024)/1024)/1024)] GB
HOWTO show Cisco ASA 5510 Cpu Usage & Connections
Cisco ASA Cpu Usage: CPU Load 1min: [oid("1.3.6.1.4.1.9.9.109.1.1.1.1.5.1")] % Total Connections: [oid("1.3.6.1.4.1.9.9.147.1.2.2.2.1.5.40.6")]
HOWTO show Cisco 3750 CPU USAGE
Cisco 3750 switch Cpu Usage LAST 5 SEC AVG : [oid("1.3.6.1.4.1.9.2.1.56.0")] Cisco 3750 switch Cpu Usage LAST 1 MNT AVG : [oid("1.3.6.1.4.1.9.2.1.57.0")] Cisco 3750 switch Cpu Usage LAST 5 MNT AVG : [oid("1.3.6.1.4.1.9.2.1.58.0")]
HOWTO show Cisco 3750 Switch Temperature
Temperature : [oid("1.3.6.1.4.1.9.9.13.1.3.1.3.1006")]
HOWTO show EATON UPS 9155 : Temperature/Volts/Load
UPS Temp: [oid("1.3.6.1.4.1.534.1.6.1.0")] Volts: [oid("1.3.6.1.2.1.33.1.3.3.1.3.1")] LOAD [oid("1.3.6.1.2.1.33.1.4.4.1.5.1")] % Backup Time Remaining: [oid("1.3.6.1.2.1.33.1.2.3.0")]
EATON Powerware Environment Monitoring Probe [EMP]
NOC Room Temperature : [oid("1.3.6.1.4.1.534.1.6.5.0")] NOC Room Humidity : [oid("1.3.6.1.4.1.534.1.6.6.0")]
EMERSON LIBERT 10kva UPS Monitoring Probe [EMP]
INPUT Volt: [oid("1.3.6.1.4.1.13400.2.16.2.2.1.0")/100] LOAD [oid("1.3.6.1.4.1.13400.2.16.2.3.6.0")/100] % Battery Volt [oid("1.3.6.1.4.1.13400.2.16.2.5.1.0")/100] Backup Time: [oid("1.3.6.1.4.1.13400.2.16.2.5.2.0")] # Temperature & Humidity are not builtin feature, separate sensor module should be attached with the UPS like IRM-S02TH Temperature: [oid("1.3.6.1.4.1.13400.2.62.2.1.2.0")/100] Humidity: [oid("1.3.6.1.4.1.13400.2.62.2.1.3.0")/100]
HOWTO show all CPU’s Load
Load on [array_size(oid_column("iso.org.dod.internet.mgmt.mib-2.host.hrDevice.hrProcessorTable.hrProcessorEntry.hrProcessorLoad"))] CPU('s): [oid_column("iso.org.dod.internet.mgmt.mib-2.host.hrDevice.hrProcessorTable.hrProcessorEntry.hrProcessorLoad")]
Howto add MYSQL or any service probe
IBM Lotus Domino Server
Mail Waiting: [oid("1.3.6.1.4.1.334.72.1.1.4.6.0")] Server Availability Index: [oid("1.3.6.1.4.1.334.72.1.1.6.3.19.0")] Lotus DB Connected Users: [oid("1.3.6.1.4.1.334.72.1.1.6.3.6.0")]
Howto Show System/Device UPTIME
Uptime: [string_substring(oid("1.3.6.1.2.1.1.3.0"),0,8)]
Howto Send SMS alerts via DUDE.
https://aacable.wordpress.com/2013/11/02/mikrotik-dude-sms-notification/
Howto Show Cisco SG300/SG500 CPU Load
CPU: [oid("1.3.6.1.4.1.9.6.1.101.1.7.0")]
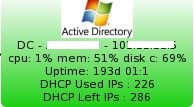
Windows Server DHCP Information
[Device.Name] [device_performance()][Device.ServicesDown]Uptime: [string_substring(oid("1.3.6.1.2.1.1.3.0"),0,9)] DHCP Used IPs : [oid("iso.3.6.1.4.1.311.1.3.2.1.1.2.101.0.0.0")] DHCP Left IPs : [oid("iso.3.6.1.4.1.311.1.3.2.1.1.3.101.0.0.0")]
Windows High Memory Usage Function
Add new PROBE
Name: Memory Usage Above 80% Type Function: Agent: Default Available: if(mem_usage()>0, 1, -1) Error: if(mem_usage() 80%") Value: mem_usage() Unit: %
APC SMARTUPS 1500 Series with APC Web/SNMP Management Card
General
UPS Type .1.3.6.1.4.1.318.1.1.1.1.1.1.0
String containing UPS model, eg: Smart-UPS 1000
Battery Information
Battery capacity .1.3.6.1.4.1.318.1.1.1.2.2.1.0
Battery capacity as % of total
Battery temperature .1.3.6.1.4.1.318.1.1.1.2.2.2.0
Battery temperature in Celcius of Farenheit – depending on how UPS is configured
Battery runtime remain .1.3.6.1.4.1.318.1.1.1.2.2.3.0
Total battery runtime available based on current load.
Battery replace .1.3.6.1.4.1.318.1.1.1.2.2.4.0
If result = 2 then battery needs replacing (1 = ok)
UPS Input
Input voltage .1.3.6.1.4.1.318.1.1.1.3.2.1.0
Input voltage, to the UPS device
Input frequency .1.3.6.1.4.1.318.1.1.1.3.2.4.0
Input frequency in Hz
Reason for last transfer .1.3.6.1.4.1.318.1.1.1.3.2.5.0
String containing reason for last transfer to battery power
1 No events
2 High line voltage
3 Brownout
4 Loss of mains power
5 Small temporary power drop
6 Large temporary power drop
7 Small spike
8 Large spike
9 UPS self test
10 Excessive input voltage fluctuationUPS Output
Output voltage .1.3.6.1.4.1.318.1.1.1.4.2.1.0
Output voltage from the UPS
Output frequency .1.3.6.1.4.1.318.1.1.1.4.2.2.0
Output frequency in Hz
Output load .1.3.6.1.4.1.318.1.1.1.4.2.3.0
Output load expressed as % of capacity
Output current .1.3.6.1.4.1.318.1.1.1.4.2.4.0
Output current in Amps
Diagnostics
Comms .1.3.6.1.4.1.318.1.1.1.8.1.0
Whether SNMP agent is communicating with UPS device 1 = yes, 2 = no
Last Self Test result .1.3.6.1.4.1.318.1.1.1.7.2.3.0
Result of last self test as text string. eg: pass or fail.
Last Self Test date .1.3.6.1.4.1.318.1.1.1.7.2.4.0
Date of last self test
Notes on DUDE polling section
Default settings are 30 seconds for poll interval, 10 seconds for timeout, and downcount of 5.
The Dude (as well as most active monitoring systems) actively polls (queries) the devices that it is managing. This poll typically is a standard ICMP ping to determine if the device is still alive on the network. It can also be other things such as a check of a telnet, ssh, or http port. The poll interval is how often does it query (ping) a specific device. Default is 30 seconds, therefore The Dude will ping each device once every 30 seconds.
The timeout parameter is how long The Dude waits for a reply from a ping or check of a telnet, ssh, or http port before considering it a failed response.
The downcount parameter is how many failed responses are required before The Dude declares the device as a failed device.
Default situation is 30 second poll interval with 10 seconds timeout and downcount of 5. Therefore, you would have 5 polls at 30 second intervals plus 10 seconds would need to be failed before you see a declaration of a failed device (2 minutes and 40 seconds).
These parameters are adjustable because with a larger network you want to increase the poll interval to reduce network traffic from the monitoring system. The Dude however allows you to set the poll interval/timeout/downcount individually for each device. This way you can set a value that is good for your individual network as the default and then set values that are significantly smaller for high priority devices such as the company’s main database server.
☺
Regard’s
~ Syed Jahanzaib ~


I have configured exactly same as you have shown in this. But I can’t see anything coming on screen. No computer/ip address of any node is shown in the dude.
Do I need to define something on mikrotik router board?
Please help me.
LikeLike
Comment by Ravi — December 14, 2011 @ 12:49 PM
Dear jahazaid vai,
i want to add user name and password in dude windows PC locally, how it possible. i have tried it but show “login failed: invalid username and password”.
please reply ..
Best regards
Julhas
LikeLike
Comment by julhas@bdcom.com — January 1, 2015 @ 11:39 AM
by default dude have no password.
Login to dude, on left window menu, click ADMINS, then on your right you will see all the user ids , double click on admin id and change its password.
LikeLike
Comment by Syed Jahanzaib / Pinochio~:) — January 2, 2015 @ 11:18 AM
First thing first, Are you using it on Mikrotik ?
Also it Depends on how your mikrotik/firewall is configured.
Check with your local config. Try adding few ips one by one. If user end ping/icmp is blocked, then you won’t be able to see any PC in the graphs, so its better to use another approach /combination on “Device name preferences”.
LikeLike
Comment by Pinochio~:) — December 14, 2011 @ 1:41 PM
Assalam O Alakum, Well jehanzeb bahi the blog is full of pretty good information on Mikrotik. I have a problem. I want to set a contention ratio in Mikrotik. How can i do this.
badshahzeb@yahoo.com. Please send me the reply on the mail address given. I would be very thankful.
LikeLike
Comment by Amirzeb — February 25, 2012 @ 4:41 PM
my dude works fine on XP but on 7 it won’t work properly?
LikeLike
Comment by Hennie — June 27, 2012 @ 7:39 PM
i can’t start it on win 7 professional. I stay on language selection… No matter which language i select, it stays on the same dialog box and is reseted to english…
Thanks for help.
LikeLike
Comment by Roland — February 20, 2015 @ 12:48 PM
Dear Jehanzeb !
Thanks for your all time support and such a great blog where we can find almost every solution to our needs. I have also configured the DUDE as per your directions but the issue is this that when i open it in IE 9 (Win 7) or Google Chrome (Win 7) it is displaying everything but no world MAP. Do i need to activate the world map individually?
LikeLike
Comment by Qamar — July 6, 2012 @ 9:04 PM
I haven’t faced this issued. Where your map image file is residing, it must be uploaded by dude in its folder.
LikeLike
Comment by Syed Jahanzaib / Pinochio~:) — July 7, 2012 @ 5:21 PM
Very useful for me, now I’ve got answers on several rather important questions.
Thank you.
LikeLike
Comment by Александр Каталымов — August 23, 2012 @ 8:48 AM
SIr local Ping bohat masla kar raha ha kiya karo mikrotik5.18 ha
LikeLike
Comment by arsalan — August 25, 2012 @ 2:01 PM
maybe you can help me solve my confusion ..
I want to create an email notification .. I’ve created an account on the mail server dude@company.com, and I gave it the password admindude .. how do I enter the password of dude@company.com to dude server??it is needed,isn,it??
wish you can help me
LikeLike
Comment by tomy — September 10, 2012 @ 7:35 AM
can I see my employee’s bandwidth uses …. actually some of my employee download many things and it affect on my network….. plz tell me how to control their bandwidth
LikeLike
Comment by NISHAT — September 11, 2012 @ 10:01 AM
Easiest way is to install a RB750 between your internet and your computers on your network. Map every IP adress in the simple queues, and set bandwidth limits there. this way you could see what the usage is, and limit them per connection, without effecting your intra network speed. some other forums have scripts to help you set up a daily export method to mail for a report on the usage.
LikeLike
Comment by Techy — October 1, 2012 @ 11:47 AM
Hi, I saw on the graph you control vmware server. Could you tell us how to do to control a VMWare server from The Dude? thank you very much.
LikeLike
Comment by Luciano — December 6, 2012 @ 4:50 PM
Hmm Actually You can’t CONTROL the Vmware Server from the DUDE, just few functions that can be performed via using custom script. for example batch file that can do ssh to VM and do specific task like power OFF, or POWER ON, or stuff like this which can done using CLI. and it can tagged with Dude Action using Right click on that particular server.
What specific functions you want to control ?
LikeLike
Comment by Syed Jahanzaib / Pinochio~:) — December 7, 2012 @ 8:48 PM
I am using the Instructions for Ping delay, I literally copied and pasted your settings and the service is throwing a “parse failed” error message. Any suggestions?
LikeLike
Comment by Derrick — December 19, 2012 @ 1:35 AM
What is the mikrotik version you are using ?
LikeLike
Comment by Syed Jahanzaib / Pinochio~:) — December 19, 2012 @ 10:10 AM
Using windows installed The dude version 4.0b3
LikeLike
Comment by Derrick — December 19, 2012 @ 7:18 PM
I also struggle with the “parse failed” error message. *bump*
LikeLike
Comment by Stian Johansen — April 2, 2013 @ 4:44 PM
Exactly where you are getting this error ? post details. Parse error usually comes when dude doesn’t understand the code your enter in create agent/probe , sytanx mistakes are common issues
LikeLike
Comment by Syed Jahanzaib / Pinochio~:) — April 3, 2013 @ 9:15 AM
Hi,
I also struggle with the “parse failed” error message. I use the latest version 4.0Beta
First i’d like to test it with the notepad.exe so i created this probe:
Type: function
Available: if(array_find(oid_column(“1.3.6.1.2.1.25.4.2.1.2″),”NOTEPAD.EXE”)>0, 1, -1)
Error: if(array_find(oid_column(“1.3.6.1.2.1.25.4.2.1.2″),”NOTEPAD.EXE”)>0, “”, “NOTEPAD.EXE not detected by SNMP probe”)
Value: 1
Unit: running
Rate: none
Then, I got “parse failed” error message.
I tried to use “SNMPB”, “PowerSNMP Free Manager” to get the information “1.3.6.1.2.1.25.4.2.1.2”, it can’t get any information. But I can get the information of “1.3.6.1.2.1.1.1.0”.
I don’t know if I miss something there and which I set wrong in code.
Please advise me and thank you in advance.
LikeLike
Comment by Bruce — October 14, 2014 @ 5:48 AM
Sorry, I have worked it out.
The original code is from another site and its quotation marks are different so that it failed. While I use your code, it is also failed, too.
for example:
Your is: if(array_find(oid_column(1.3.6.1.2.1.25.4.2.1.2), notes2.exe)0, 1, -1)
After I use : if(array_find(oid_column(“1.3.6.1.2.1.25.4.2.1.2”), “notes2.exe”)>0, 1, -1)
After correcting, I get it to work.
Thank you for your nice article that I have not seen before.
May I have your contact mail?
LikeLike
Comment by Bruce — October 14, 2014 @ 6:41 AM
Actually some times wordpress coding sucks and they mess with many special characters thats why codes gets messed up. I will check the coding again in free time and correct it if any error is in there,.
LikeLike
Comment by Syed Jahanzaib / Pinochio~:) — October 14, 2014 @ 8:20 AM
Thank you for your soon reply. I appreciate it. I finally know how to setup and config the Dude. By the way, how I set the function to restart the service while it failed?
Please advise me and thank you in advance.
LikeLike
Comment by Bruce — October 14, 2014 @ 9:04 AM
You can use tool/function combination also and tag it with notification. you can use external syslog server also which can act upon the failure. or do ssh to remote pc and restart the service.
LikeLike
Comment by Syed Jahanzaib / Pinochio~:) — October 14, 2014 @ 9:11 AM
great information..!! thank you so much for this article
LikeLike
Comment by Dedi — April 26, 2013 @ 10:02 AM
Hi Syed, thanks for the instructionals. By the way is it possible to view the Queues entries from the Dude in this set-up. I have tried my best looking for a way to do this but it seems that I can’t find a way. What I want is to view the history of the queues I have made like email connections, vpn connections etc. I don’t want to use graphing by the way. Thanks in advanced
LikeLike
Comment by Jessie Bautista — July 16, 2013 @ 8:50 PM
I dont think queues history is possible.
LikeLike
Comment by Syed Jahanzaib / Pinochio~:) — July 18, 2013 @ 10:01 AM
Thanks for this information it is very kind of you
LikeLike
Comment by Erastus — September 3, 2013 @ 9:44 AM
Hi Syed, I am a newb with The Dude and I am already pretty discouraged. I just cannot get The Dude to map out my network. I have tried all kinds of stuff without success. Is the fact that I still have Network Magic, which I am looking to replace by The Dude, installed on my computers could be blocking The Dude from drawing my network map. Please I would really appreciate your help to get The Dude working for me.
Thanks,
Adelphie
LikeLike
Comment by Normand Nault — October 31, 2013 @ 7:26 PM
let me know how can I help you,
LikeLike
Comment by Syed Jahanzaib / Pinochio~:) — October 31, 2013 @ 10:24 PM
Well just as I said before, could you help me get The Dude to map out my network, to give me ideas as to why it does not do it as it is supposed to do. Could the fact that I still have Network Magic installed on my computers affect the performance of The Dude? I need your help to get The Dude working for me.
Thanks again.
LikeLike
Comment by Normand Nault — November 1, 2013 @ 6:51 AM
maybe we can have a basic remote session. email me at aacable [at] hotmail . com
LikeLike
Comment by Syed Jahanzaib / Pinochio~:) — November 1, 2013 @ 11:03 AM
I’m using The Dude 3.6 windows version and would like to just monitor the bandwidth and see who’s doing all the hogging. Is there a specific probe to allow this function?
LikeLike
Comment by Robert Bonds — February 13, 2014 @ 1:33 AM
Mikrotik DUDE is not designed to monitor internet bandwidth for users. Mikrotik DUDE works with SNMP , so monitoring bandwidth usage for each user with SNMP would be a overhead management. You can monitor server’s / devices / routers type peripheral more efficiently with the dude.
LikeLike
Comment by Syed Jahanzaib / Pinochio~:) — February 13, 2014 @ 10:01 AM
Thank you and I appreciate your response.
LikeLike
Comment by Robert Bonds — February 13, 2014 @ 7:54 PM
Salam Syed, I am using CCR1016-12G, the dude package for this product does not available, what should I do? In addition I want to use “traffic flow” function trough DUDE. Thanks in advance
LikeLike
Comment by Pooyan — February 15, 2014 @ 3:31 AM
what does it mean when a link between two devices turns RED COLOUR?
LikeLike
Comment by pascal — May 9, 2014 @ 6:48 PM
it means the data transfer is in progress between two devices, or you can adjust the speed for that link, for example 10 mb, if the speed comes near or above 10 mb, the link will become RED, indicating load conditions visually, useful for monitoring purposes.
LikeLike
Comment by Syed Jahanzaib / Pinochio~:) — May 13, 2014 @ 10:07 AM
Hi Syed
I have a cisco switch 3750 stack, i enabled snmp on it and i can see the ports.
Now i want to display in the label the switch cpu load 5 sec and temeprature.
I used like you said:
Temperature : [oid(“1.3.6.1.4.1.9.9.13.1.3.1.3.1006”)]
It is not displaying the temp value, same for CPU, however if i make snmpwalk for those oid from another software it is showing results.
Please advise, i am using dude3.6 on debian server via wine.
LikeLike
Comment by bernard — October 7, 2014 @ 7:08 PM
greeting
after years, I can not connect to server dude without changing the password or someone intervene.
Does anyone know how to recover or unlock?
It can reinstall without losing the old settings?
thanks in advance
LikeLike
Comment by marius — November 28, 2014 @ 12:23 PM
hello i have been using Dude monitoring for the past 6 month…recently i start using sound alert notification,.but the problem is it notify me every single service outage …how can i make the notification for specific devices only
thanks….
LikeLike
Comment by samuel — March 18, 2015 @ 2:14 PM
[…] Guide […]
LikeLike
Pingback by Resources | net601bitninjas — June 23, 2015 @ 3:14 AM
i have a Mikrotik PC not mikrotik routerboard , can i install dude.npk in my mikrotik pc? please let me know.
LikeLike
Comment by Sajib Nandi — December 15, 2015 @ 10:37 AM
yes u can, (with same ver)
LikeLike
Comment by Syed Jahanzaib / Pinochio~:) — December 21, 2015 @ 7:35 PM
great Page !!!
i wonder how can i monitor an external website ?
lets say im hosting a website on go-daddy servers, i can monitor that the url of my website resolving to ip address
and i can ping this address, so its monitoring that this ip is alive, but how can i be sure that the specific website is alive ?
LikeLike
Comment by David Shuhami — February 4, 2016 @ 8:57 PM
Hi There,
I found that there isn’t much of a way to see packet loss graphs on the dude. Is there a way to create a ping probe that I can use(without using SNMP) to monitor packet loss. Will be cool to do like 10 pings checks…
Thanks,
Pi
LikeLike
Comment by Peter — March 4, 2016 @ 9:01 AM
have you tried SMOKEPING?
amazing tool to plot latency 🙂
https://aacable.wordpress.com/2014/07/07/smokeping-to-monitor-network-latency-in-ubuntu/
https://aacable.wordpress.com/tag/aacable-smokeping/
LikeLike
Comment by Syed Jahanzaib / Pinochio~:) — March 4, 2016 @ 2:27 PM
We have DUDE running and love the reporting it gives, I am wondering if it is possible to adjust the SNMP polling times? I see where it is possible for the services but not sure how to reduce the SNMP traffic.
LikeLike
Comment by Jim — March 22, 2016 @ 9:18 PM
see the POLLING section in settings. You can change the global polling, or per device as well too
LikeLike
Comment by Syed Jahanzaib / Pinochio~:) — March 26, 2016 @ 5:00 PM
Hello,
Thanks for the useful information!
When trying to get the latency on the label it just displays the test of the code and not the Ms. Using 4.0beta3
LikeLike
Comment by Craig — April 14, 2016 @ 2:01 PM
Hi everyone. I am trying to set the ping latency on Dude. If any one have any about that. Kindly contact to me on vijay.k@vayudoot.in & 7831017878. My Name is Vijay Kumar.
LikeLike
Comment by Vijay Kumar — April 18, 2016 @ 10:25 AM
Hello Sir
I installed dude version 3.6 on my windows 8.1
I add Huawei switch with Dude.
I am not able to take telnet.
Remote connection
and
Not able to measure the bandwidth?
Can anyone reply me that how to measure the Bandwidth and also all remaining parameters.
LikeLike
Comment by Jagdish — May 4, 2016 @ 3:50 PM
3.6 is way too old. use at least 4.x
LikeLike
Comment by Syed Jahanzaib / Pinochio~:) — May 10, 2016 @ 1:19 PM
Hi! Can you provide correct code for section “HOWTO check if specific program is running or not [using taskmgr list]” because with this code The Dude probe status = parse failed.
LikeLike
Comment by nimbo78 — June 2, 2016 @ 12:56 AM
@nimbo78
I have updated the post with snapshot. In this example I used lotus domino service by checking nserver.exe . its working fine.
LikeLike
Comment by Syed Jahanzaib / Pinochio~:) — June 6, 2016 @ 3:58 PM
Be carefull, Dude on 386 router hangs the system and has a big impact on the router. Best to use it in windows env.
LikeLike
Comment by Erastus Coetzee — June 6, 2016 @ 4:03 PM
Dude on router has a big impact on the router CPU resources. It is best to use it on a separate windows base system for more customized control.
LikeLike
Comment by Syed Jahanzaib / Pinochio~:) — June 6, 2016 @ 4:24 PM
hi again, I’ve tried updated function, but it doesn’t work in 6.35.2 Dude: Problem: too few parameters (2 < 3) for if
LikeLike
Comment by nimbo78 — June 6, 2016 @ 11:47 PM
how to get the number of connected clients on CISCO 702-i Access point…
LikeLike
Comment by Nirmal — November 2, 2016 @ 5:06 PM
Hi, really good web!
Do you know how to monitor HTTPS on a WEB? but not only port 443, thanks in advance.
LikeLike
Comment by Oscar — April 4, 2017 @ 9:42 PM
you cant monitor https with simple Mikrotik.
LikeLike
Comment by Syed Jahanzaib / Pinochio~:) — April 17, 2017 @ 11:16 AM
is there a way to run a script on multiple routers without log in to them, as an example, multiple mikrotik routers which are monitored using the dude.
Thanks,
Hope someone will have an answer for my question.
LikeLike
Comment by Anushka Udeshan — July 1, 2017 @ 12:38 PM
alhamdulillah shumma alahamdulillah jazzakumullah khair brother zaib bai…..lots of doubts is clear thank you so much
LikeLike
Comment by Njaan Soofi — October 11, 2017 @ 1:44 AM
Welcome.
LikeLike
Comment by Syed Jahanzaib / Pinochio~:) — October 16, 2017 @ 3:49 PM
Dear Jahanzaib! I have installed dude for windows v4.0beta3 from the download link mentioned above. I installed it on windows 10. It installed well but I can’t log in now. it gives error “not connected, cannot resolve address”. please guide me. also please confirm can I use Dude for Juniper, Foundary and DLink switches?
LikeLike
Comment by Ashraf Jahanzeb — November 20, 2017 @ 12:35 PM
you can inquire any device which supports SNMP, doesnt matter if its Windows / Linux / Mikrotik / Cisco or other.
LikeLike
Comment by Syed Jahanzaib / Pinochio~:) — November 20, 2017 @ 4:41 PM
thnx for prompt reply Jahanzaib. pl also guide on connection. it doesnot connect. what all I can check.. regards
LikeLike
Comment by Ashraf Jahanzeb — November 21, 2017 @ 11:23 AM
Dear Jahanzaib please also guide on the log in problem. will appreciate your early reply
LikeLike
Comment by Ashraf Jahanzeb — November 23, 2017 @ 8:03 AM
default pass of dude is empty. jsut admin id and no passwd
LikeLike
Comment by Syed Jahanzaib / Pinochio~:) — November 23, 2017 @ 9:15 AM
Dear Jahanzaib I know that. It doesnot login with that and doesnot connect
LikeLike
Comment by Ashraf Jahanzeb — November 23, 2017 @ 12:58 PM
have you tried it removing completely & re.install ?
LikeLike
Comment by Syed Jahanzaib / Pinochio~:) — November 23, 2017 @ 1:01 PM
Will try that and let you know
LikeLike
Comment by Ashraf Jahanzeb Khan — November 23, 2017 @ 6:44 PM
Dear Jahanzaib! I uninstalled it completely and then reinstalled it but the problem persists. at top it is showing “not connected” and at the bottom left side it shows “cannot resolve address”. it keeps on auto connecting as well but does not connect. Whereas the local server is running and showing green bulb.
LikeLike
Comment by Ashraf Jahanzeb — November 24, 2017 @ 10:43 AM
Dear Jahanzaib! please advise on the stated problem. how to go about it.
LikeLike
Comment by Ashraf Jahanzeb — November 30, 2017 @ 10:55 AM
Dear Jahanzaib! pl advise
LikeLike
Comment by ASHRAF — December 15, 2017 @ 10:01 AM
I know is too late, but maybe helps others: on windows 10 I could login changing LOCALHOST to 127.0.0.1 Not sure why (on CMD of course I can ping localhost ipv4/ipv6 and resolves well) weird…
LikeLike
Comment by Ernesto Abarca — April 21, 2020 @ 10:32 PM
Thank you for sharing the tip 🙂
LikeLike
Comment by Syed Jahanzaib / Pinochio~:) — April 23, 2020 @ 10:46 AM
park Locksmith services
Monitoring Network with the DUDE (PC x86 or Mikrotik NPK Ver) | Syed Jahanzaib Personal Blog to Share Knowledge !
LikeLike
Trackback by complex id card — June 2, 2018 @ 11:44 AM
Hi, can you please assist with “HOWTO Check for High Delay via Ping Function/Probe” I run The Dude v6.46.1 and I keep on get “cannot parse” when I try and run your setup…
LikeLike
Comment by Theuns Bezuidenhout — February 9, 2020 @ 2:49 PM