DRAFT VERSION: This is incomplete Post ! Some points may be missing, I will update them later ..

We all know what is MRTG. You can graph so many information including temperature humidity, speed, voltage, uptime, routers, active numbers of users, number of printouts and sometimes out of the box graphing/zaib.
In this post, I am just posting reference material on how to move plain mrtg graphs to RRD. The advantage of RRD over MRTG is that using RRD you can generate the graphs on the fly, as opposed as MRTG that generates the graphs all the time, no matter that nobody sees the generated HTML pages or not. we can use RRD to make graphs with one minute interval, whereas in plain MRTG, we have to use 5 minutes interval which is not good to monitor jerks or sensitive devices.
For initial / basic level of MRTG installation on Ubuntu Server , refer to the inernet or my previous post at
https://aacable.wordpress.com/tag/mrtg-installation-on-ubuntu/
Sample CFG Files:
main MRTG.CFG file
cat /etc/mrtg.cfg
#########################
# START OF /etc/mrtg.cfg#
#########################
# Author: Syed Jahanzaib
# Email : aacable@hotmail.com
# Web : https://aacable.wordpress.com
WorkDir: /var/www/mrtg
Options[_]: growright,nobanner,pngdate,noinfo,nobanner
XSize[_]: 600
YSize[_]: 200
EnableIPv6: no
RunAsDaemon: no
Interval: 1
Logformat: rrdtool
#Use MIBS as per your local config, make sure you download the mibs as mentioned here
# https://aacable.wordpress.com/tag/mrtg-installation-on-ubuntu/
LoadMIBs: /cfg/mibs/HOST-RESOURCES-MIB /cfg/mibs/IF-MIB /cfg/mibs/UCD-SNMP-MIB
PageFoot[^]: Page managed by SYED JAHANZAIB
AddHead[_]:
<img src="data:image/gif;base64,R0lGODlhAQABAIAAAAAAAP///yH5BAEAAAAALAAAAAABAAEAAAIBRAA7" data-wp-preserve="%3Cstyle%20type%3D%22text%2Fcss%22%3E%20%3C!.%20a%20%7B%20color%3A%20%23263F66%3B%20text-decoration%3A%20none%3B%20%7D%20a%3Ahover%20%7B%20color%3A%20%23785B41%3B%20text-decoration%3A%20none%3B%20%7D%20body%20%7B%20color%3A%20black%3B%20font%3A%208pt%20Verdana%2C%20Geneva%2C%20Arial%2C%20Helvetica%2C%20sans-serif%3B%20%7D%20h1%20%7B%20font%3A%20bold%2016pt%20Verdana%2C%20Geneva%2C%20Arial%2C%20Helvetica%2C%20sans-serif%3B%20color%3A%20%23342A21%3B%20%7D%20h2%20%7B%20color%3A%20%23666666%3B%20font%3A%20bold%2012pt%20Verdana%2C%20Geneva%2C%20Arial%2C%20Helvetica%2C%20sans-serif%3B%20%7D%20h3%20%7B%20color%3A%20black%3B%20font%3A%20bold%209pt%20Verdana%2C%20Geneva%2C%20Arial%2C%20Helvetica%2C%20sans-serif%3B%20%7D%20table%20%7B%20border%3A%200%3B%20%7D%20td%20%7B%20background-color%3A%20%23E7DDD3%3B%20border%3A%200px%20solid%20%23FFFFFF%3B%20color%3A%20Black%3B%20font%3A%208pt%20Verdana%2C%20Geneva%2C%20Arial%2C%20Helvetica%2C%20sans-serif%3B%20vertical-align%3A%20top%3B%20%7D%20th%20%7B%20background-color%3A%20%23735A4A%3B%20color%3A%20White%3B%20font%3A%2011px%20Verdana%2C%20arial%2C%20geneva%2C%20helvetica%2C%20sans-serif%3B%20border%3A%200%3B%20font-weight%3A%20bold%3B%20text-align%3A%20left%3B%20%7D%20.%3E%20%3C%2Fstyle%3E" data-mce-resize="false" data-mce-placeholder="1" class="mce-object" width="20" height="20" alt="<style>" title="<style>" />
Background[_]: #F6F1EE
# Change it as required , it means mrtg will read following file and will create graphs based on its contents
# ADD remove them as required, they are added for reference purposes only
#Include: /cfg/temp.cfg
Include: /cfg/kesc.cfg
Include: /cfg/lanwan.cfg
Include: /cfg/radius.cfg
Include: /cfg/mt.cfg
Include: /cfg/ping.cfg
#Include: /cfg/vlan.cfg
##################
# END OF /etc/mrtg.cfg #
##################
radius.cfg
# Created by
# /usr/bin/cfgmaker public@10.0.0.1

# or for NT
WorkDir: /var/www/mrtg

### Interface 2 >> Descr: 'eth0' | Name: 'eth0' | Ip: '1' | Eth: '00' ###

Target[10.0.0.1_eth0]: #eth0:public@10.0.0.1:
SetEnv[10.0.0.1_eth0]: MRTG_INT_IP="10.0.0.1" MRTG_INT_DESCR="eth0"
MaxBytes[10.0.0.1_eth0]: 125000000
Title[10.0.0.1_eth0]: Traffic Analysis for eth0 -- BILLING
PageTop[10.0.0.1_eth0]:
<h1>Traffic Analysis for eth0 -- BILLING</h1>
<div id="sysdetails">
<table>
<tr>
<td>System:</td>
<td>in "BILLING"</td>
</tr>
<tr>
<td>Maintainer:</td>
<td>aacable at hotmail dot com</td>
</tr>
<tr>
<td>Description:</td>
<td>eth0</td>
</tr>
<tr>
<td>ifType:</td>
<td>ethernetCsmacd (6)</td>
</tr>
<tr>
<td>ifName:</td>
<td>eth0</td>
</tr>
<tr>
<td>Max Speed:</td>
<td>125.0 MBytes/s</td>
</tr>
<tr>
<td>Ip:</td>
<td>10.0.0.1 (click.onmypc.net)</td>
</tr>
</table>
</div>
#Percent of memory used
Target[radius_server_mem_ram]: ( hrStorageUsed.1&hrStorageUsed.1:public@10.0.0.1) * 100 / ( hrStorageSize.1&hrStorageSize.1:public@10.0.0.1 ) / 10
Title[radius_server_mem_ram]: Memory usage for Radius Server
PageTop[radius_server_mem_ram]:
<H1> Memory usage for Radius Server </H1>

MaxBytes[radius_server_mem_ram]: 100
AbsMax[radius_server_mem_ram]: 100
ShortLegend[radius_server_mem_ram]: %
YLegend[radius_server_mem_ram]: % of Memory
Legend1[radius_server_mem_ram]: Used Memory
LegendI[radius_server_mem_ram]: Used :
LegendO[radius_server_mem_ram]:
Options[radius_server_mem_ram]: growright,nopercent,gauge,integer,nobanner,printrouter,pngdate,noo
#Unscaled[radius_server_mem_ram]: ymwd

Target[linux_server_dis_usage]: ( hrStorageUsed.31&hrStorageUsed.31:public@10.0.0.1 ) * 100 / ( hrStorageSize.31&hrStorageSize.31:public@10.0.0.1 ) / 8
Title[linux_server_dis_usage]: Disk usage for Linux Server
PageTop[linux_server_dis_usage]:
<H1> Disk usage for Linux Server </H1>

MaxBytes[linux_server_dis_usage]: 100
AbsMax[linux_server_dis_usage]: 100
ShortLegend[linux_server_dis_usage]: %
YLegend[linux_server_dis_usage]: % of RM_DISK
Legend1[linux_server_dis_usage]: Used RM_DISK
LegendI[linux_server_dis_usage]: Used :
LegendO[linux_server_dis_usage]:
Options[linux_server_dis_usage]: growright,gauge,integer,nobanner,printrouter,pngdate,noo,nopercent,logscale
#Unscaled[linux_server_dis_usage]: ymwd
Mikrotik Sample CFG File
workdir: /var/www/mrtg/
#Options[_]: growright,nopercent

# Z_CCR_MIKROTIK CCR_1036 PPPoE ACTIVE Users
Target[mtPPPoEusers]: 1.3.6.1.4.1.9.9.150.1.1.1.0&1.3.6.1.4.1.9.9.150.1.1.1.0:public@10.0.0.1 / 8
Title[mtPPPoEusers]: Active PPPoE Users on Z_CCR_MIKROTIK CCR_1036
PageTop[mtPPPoEusers]:
<H1>Active PPPoE Users on Z_CCR_MIKROTIK CCR_1036</H1>

MaxBytes[mtPPPoEusers]: 2000
Colours[mtPPPoEusers]: B#8888ff,B#8888ff,B#5398ff,B#5398ff
Options[mtPPPoEusers]: growright,nopercent,gauge,integer,nobanner,printrouter,pngdate,noo
LegendI[mtPPPoEusers]: Active PPPoE Users on MT
LegendO[mtPPPoEusers]:
YLegend[mtPPPoEusers]: Active PPPoE Users on MT
Legend1[mtPPPoEusers]: Active PPPoE Users on MT
Legend2[mtPPPoEusers]:
#Unscaled[mtPPPoEusers]: dwmy

### Z_CCR_MIKROTIK CCR_1036 192.168.100.2 CPU load ###
Target[192.168.100.2_cpu]: 1.3.6.1.2.1.25.3.3.1.2.1&1.3.6.1.2.1.25.3.3.1.2.1:public@10.0.0.1 / 8
AbsMax[192.168.100.2_cpu]: 100
MaxBytes[192.168.100.2_cpu]: 100
Title[192.168.100.2_cpu]: Z_CCR_MIKROTIK CCR_1036 CPU load
PageTop[192.168.100.2_cpu]:
<H1>Z_CCR_MIKROTIK CCR_1036 CPU load</H1>

Options[192.168.100.2_cpu]: growright,gauge,integer,nobanner,printrouter,pngdate,noo,nopercent
Legend1[192.168.100.2_cpu]: CPU load
YLegend[192.168.100.2_cpu]: CPU load
ShortLegend[192.168.100.2_cpu]: %
LegendI[192.168.100.2_cpu]: CPU load (percentage)
#Unscaled[192.168.100.2_cpu]: y

### MONITORING Z_CCR_MIKROTIK CCR_1036 CPU TEMP ###
Target[mt.cpu.temp]: 1.3.6.1.4.1.14988.1.1.3.11.0&1.3.6.1.4.1.14988.1.1.3.11.0:public@10.0.0.1 / 100
Options[mt.cpu.temp]: gauge, growright, nopercent, noinfo
MaxBytes[mt.cpu.temp]: 100
Colours[mt.cpu.temp]: RED#ff4f27,Y#fffb15,RED#ff4f27,RED#fffb15
#Unscaled[mt.cpu.temp]: dwmy
YLegend[mt.cpu.temp]: CPU Temprature
Title[mt.cpu.temp]: Z_CCR_MIKROTIK CCR_1036 RB CPU Temprature
PageTop[mt.cpu.temp]:
<H1>Z_CCR_MIKROTIK CCR_1036 RB CPU Temprature</H1>

ShortLegend[mt.cpu.temp]: c
LegendI[mt.cpu.temp]:
LegendO[mt.cpu.temp]: CPU Temp
Legend1[mt.cpu.temp]: CPU Temprature
Legend2[mt.cpu.temp]: CPU Temprature

### MONITORING Z_CCR_MIKROTIK CCR_1036 RB TEMP ###
Target[mt.rb.temp]: 1.3.6.1.4.1.14988.1.1.3.10.0&1.3.6.1.4.1.14988.1.1.3.10.0:public@10.0.0.1 / 100
Options[mt.rb.temp]: gauge, growright, nopercent, noinfo
MaxBytes[mt.rb.temp]: 100
Colours[mt.rb.temp]: RED#ff4f27,Y#fffb15,RED#ff4f27,RED#fffb15
#Unscaled[mt.rb.temp]: dwmy
YLegend[mt.rb.temp]: RB Temprature
Title[mt.rb.temp]: Z_CCR_MIKROTIK CCR_1036 Router Board Temprature
PageTop[mt.rb.temp]:
<H1>Z_CCR_MIKROTIK CCR_1036 Router Board Temprature</H1>

ShortLegend[mt.rb.temp]: c
LegendI[mt.rb.temp]:
LegendO[mt.rb.temp]: RB Temp
Legend1[mt.rb.temp]: RB Temprature
Legend2[mt.rb.temp]: RB Temprature

### MONITORING Z_CCR_MIKROTIK CCR_1036 VOLTAGE Monitor ###
Target[mt-voltage]: 1.3.6.1.4.1.14988.1.1.3.8.0&1.3.6.1.4.1.14988.1.1.3.8.0:public@10.0.0.1 / 8
Options[mt-voltage]: growright,nopercent,gauge,integer,nobanner,printrouter,pngdate
MaxBytes[mt-voltage]: 30
Colours[mt-voltage]: RED#ff4f27,Y#fffb15,RED#ff4f27,RED#fffb15
Unscaled[mt-voltage]: dwmy
YLegend[mt-voltage]: Voltaeg Monitor
Title[mt-voltage]: Z_CCR_MIKROTIK CCR_1036 Cloudcore RB VOLTAGE Monitor
PageTop[mt-voltage]:
<H1>Z_CCR_MIKROTIK CCR_1036 Cloudcore RB VOLTAGE Monitor</H1>

ShortLegend[mt-voltage]: v
LegendI[mt-voltage]:
LegendO[mt-voltage]: Voltage
Legend1[mt-voltage]: Voltage
Legend2[mt-voltage]: Voltage

### MONITORING Z_CCR_MIKROTIK CCR_1036 power.consumption Watt Usage Monitor ###
Target[mt-powerconsumption]: .1.3.6.1.4.1.14988.1.1.3.12.0&.1.3.6.1.4.1.14988.1.1.3.12.0:public@10.0.0.1 / 100
Options[mt-powerconsumption]: gauge, growright, nopercent, noinfo
MaxBytes[mt-powerconsumption]: 1000
Colours[mt-powerconsumption]: RED#ff4f27,Y#fffb15,RED#ff4f27,RED#fffb15
#Unscaled[mt-powerconsumption]: dwmy
YLegend[mt-powerconsumption]: Watts USAGE Monitor
Title[mt-powerconsumption]: Z_CCR_MIKROTIK CCR_1036 Cloudcore RB Watts Usage Monitor
PageTop[mt-powerconsumption]:
<H1>Z_CCR_MIKROTIK CCR_1036 Cloudcore RB Watts Usage Monitor</H1>

ShortLegend[mt-powerconsumption]: W
LegendI[mt-powerconsumption]:
LegendO[mt-powerconsumption]: power.consumption.wts
Legend1[mt-powerconsumption]: power.consumption.wts
Legend2[mt-powerconsumption]: power.consumption.wts

### MONITORING Z_CCR_MIKROTIK CCR_1036 FAN-2 Speed Monitor ###
Target[mt-FAN2-speed]: 1.3.6.1.4.1.14988.1.1.3.18.0&1.3.6.1.4.1.14988.1.1.3.18.0:public@10.0.0.1 / 8
Options[mt-FAN2-speed]: growright,nopercent,gauge,integer,nobanner,printrouter,pngdate,logscale,noi
MaxBytes[mt-FAN2-speed]: 10000
Colours[mt-FAN2-speed]: RED#ff4f27,Y#fffb15,RED#ff4f27,RED#fffb15
#Unscaled[mt-FAN2-speed]: dwmy
YLegend[mt-FAN2-speed]: FAN-2 RPM
Title[mt-FAN2-speed]: Z_CCR_MIKROTIK CCR_1036 Cloudcore RB FAN-2 Speed Monitor
PageTop[mt-FAN2-speed]:
<H1>Z_CCR_MIKROTIK CCR_1036 Cloudcore RB FAN-2 Speed Monitor</H1>

ShortLegend[mt-FAN2-speed]: RPM
LegendI[mt-FAN2-speed]:
LegendO[mt-FAN2-speed]: fan-2.rpm.speed
Legend1[mt-FAN2-speed]: fan-2.rpm.speed
Legend2[mt-FAN2-speed]: fan-2.rpm.speed

### MONITORING Z_CCR_MIKROTIK CCR_1036 AMP Monitor ###
Target[mt-amp-mon]: 1.3.6.1.4.1.14988.1.1.3.13.0&1.3.6.1.4.1.14988.1.1.3.13.0:public@10.0.0.1 / 10000
Options[mt-amp-mon]: gauge,growright,nopercent,pngdate,nobanner
MaxBytes[mt-amp-mon]: 30
Colours[mt-amp-mon]: RED#ff4f27,Y#fffb15,RED#ff4f27,RED#fffb15
#Unscaled[mt-amp-mon]: dwmy
YLegend[mt-amp-mon]: AMP USAGE Monitor
Title[mt-amp-mon]: Z_CCR_MIKROTIK CCR_1036 Cloudcore RB AMP Monitor
PageTop[mt-amp-mon]:
<H1>Z_CCR_MIKROTIK CCR_1036 Cloudcore RB AMP Monitor</H1>

ShortLegend[mt-amp-mon]: amp
LegendI[mt-amp-mon]:
LegendO[mt-amp-mon]: amps
Legend1[mt-amp-mon]: amps
Legend2[mt-amp-mon]: amps
ping.cfg
WorkDir: /var/www/mrtg
### ping.cfg
# 10.0.0.1 MIKROTIK NAS SERVERPING GRAPH
Title[mikrotik.ping]: MIKROTIK NAS SERVER PING RTT / Pkt LOSS Report
PageTop[mikrotik.ping]:
<H1>MIKROTIK NAS SERVER PING RTT / Pkt LOSS Report</H1>

Target[mikrotik.ping]: `/cfg/norping.sh 10.0.0.1`
Colours[mikrotik.ping]: R#f75712,G#04bf27,G#70ff53,R#70ff53
MaxBytes[mikrotik.ping]: 100
AbsMax[mikrotik.ping]: 100
Options[mikrotik.ping]: growright,gauge,pngdate,printrouter,nopercent,noinfo,logscale
#growright,nopercent,gauge
LegendI[mikrotik.ping]: Pkt LOSS
LegendO[mikrotik.ping]: Active Round Trip Time
YLegend[mikrotik.ping]: RTT
Legend1[mikrotik.ping]: Pkt LOSS
Legend2[mikrotik.ping]: Active RTT

# 8.8.8.8 GOOGLE SERVERPING GRAPH
Title[8.8.8.8.ping]: GOOGLE DNS PING RTT / Pkt LOSS Report
PageTop[8.8.8.8.ping]:
<H1>GOOGLE DNS PING RTT / Pkt LOSS Report</H1>

Target[8.8.8.8.ping]: `/cfg/norping.sh 8.8.8.8`
Colours[8.8.8.8.ping]: R#f75712,G#04bf27,G#70ff53,R#70ff53
MaxBytes[8.8.8.8.ping]: 100
AbsMax[8.8.8.8.ping]: 100
Options[8.8.8.8.ping]: growright,gauge,pngdate,printrouter,nopercent,noinfo,logscale
#growright,nopercent,gauge
LegendI[8.8.8.8.ping]: Pkt LOSS
LegendO[8.8.8.8.ping]: Active Round Trip Time
YLegend[8.8.8.8.ping]: RTT
Legend1[8.8.8.8.ping]: Pkt LOSS
Legend2[8.8.8.8.ping]: Active RTT
kesc.cfg
WorkDir: /var/www/mrtg

# 10.0.0.2 MIKROTIK AP FOR KESC RPING GRAPH
Title[kesc.ping]: K.E.S.C LIGHT FAILURE GRAPH / MRTG GRAPH
PageTop[kesc.ping]:
<H1>K.E.S.C LIGHT FAILURE / MRTG GRAPH Report ! z@iB</H1>

Target[kesc.ping]: `/cfg/kping.sh 10.0.0.2`
Colours[kesc.ping]: RED#ff4f27,GREEN#00eb0c,RED#ff4f27,RED#fffb15
MaxBytes[kesc.ping]: 100
AbsMax[kesc.ping]: 100
Options[kesc.ping]: growright,gauge,pngdate,printrouter,nopercent,noinfo,logscale
ShortLegend[kesc.ping]: %
LegendI[kesc.ping]: K.E Light Loss
LegendO[kesc.ping]: K.E Availability
YLegend[kesc.ping]: Red Bar Shows Failure (:)
norping.sh
#!/bin/bash
HOST=$1
ping -c 3 $HOST > /dev/null
DATA=`ping -c 3 $1 -q `
if [ $? -eq 0 ]
then
echo "0"
echo $DATA | awk -F/ '{print $6 }'

else
echo "100
0"
fi
APACHE / WEB SERVER Section
To enable cgi execution in /var/www/mrtg folder, edit the apache config file, and
nano /etc/apache2/sites-enabled/000-default
and paste following so that the last section of file should be like below …
<Directory /var/www/mrtg>
AddHandler cgi-script .cgi
Options +ExecCGI +Indexes
DirectoryIndex index.cgi
</Directory>
</VirtualHost>
mrtg-rrd.cgi or index.cgi to graph creation
Following CGI file will create MRTG graph on the fly (on demand)
#!/usr/bin/perl -w
# $Id: mrtg-rrd.cgi,v 1.35 2003/08/18 15:58:57 kas Exp $
# mrtg-rrd.cgi: The script for generating graphs for MRTG statistics.
# Loosely modelled after the Rainer.Bawidamann@informatik.uni-ulm.de's
# 14all.cgi
use strict;
use POSIX qw(strftime);
use Time::Local;
# The %.1f should work on 5.005+. There may be other problems, though.
# I've tested this on 5.8.0 only, so mind the gap!
require 5.005;
# Location of RRDs.pm, if it is not in @INC
# use lib '/usr/lib/perl5/5.00503/i386-linux';
use RRDs;
use vars qw(@config_files @all_config_files %targets $config_time
%directories $version $imagetype);
# EDIT THIS to reflect all your MRTG config files
BEGIN { @config_files = qw(/etc/mrtg.cfg); }
$version = '0.7';
# This depends on what image format your libgd (and rrdtool) uses
$imagetype = 'png'; # or make this 'gif';
# strftime(3) compatibility test
my $percent_h = '%-H';
$percent_h = '%H' if (strftime('%-H', gmtime(0)) !~ /^\d+$/);
sub handler ($)
{
my ($q) = @_;
try_read_config($q->url());
my $path = $q->path_info();
$path =~ s/^\///;
$path =~ s/\/$//;
if (defined $directories{$path}) {
if ($q->path_info() =~ /\/$/) {
print_dir($path);
} else {
print "Location: ", $q->url(-path_info=>1), "/\n\n";
}
return;
}
my ($dir, $stat, $ext) = ($q->path_info() =~
/^(.*)\/([^\/]+)(\.html|-(day|week|month|year)\.$imagetype)$/);
$dir =~ s/^\///;
print_error("Undefined statistics")
unless defined $targets{$stat};
print_error("Incorrect directory")
unless defined $targets{$stat}{directory} || $targets{$stat}{directory} eq $dir;
my $tgt = $targets{$stat};
common_args($stat, $tgt, $q);
# We may be running under mod_perl or something. Do not destroy
# the original settings of timezone.
my $oldtz;
if (defined $tgt->{timezone}) {
$oldtz = $ENV{TZ};
$ENV{TZ} = $tgt->{timezone};
}
if ($ext eq '.html') {
do_html($tgt);
} elsif ($ext eq '-day.' . $imagetype) {
do_image($tgt, 'day');
} elsif ($ext eq '-week.' . $imagetype) {
do_image($tgt, 'week');
} elsif ($ext eq '-month.' . $imagetype) {
do_image($tgt, 'month');
} elsif ($ext eq '-year.' . $imagetype) {
do_image($tgt, 'year');
} else {
print_error("Unknown extension");
}
$ENV{TZ} = $oldtz
if defined $oldtz;
}
sub do_html($)
{
my ($tgt) = @_;
my @day = do_image($tgt, 'day');
my @week = do_image($tgt, 'week');
my @month = do_image($tgt, 'month');
my @year = do_image($tgt, 'year');
http_headers('text/html', $tgt->{config});
print <<'EOF';
<HTML>
<HEAD>
<TITLE>
EOF
print $tgt->{title} if defined $tgt->{title};
print "</TITLE>\n";
html_comments($tgt, 'd', @{$day[0]}) if $#day != -1;
html_comments($tgt, 'w', @{$week[0]}) if $#week != -1;
html_comments($tgt, 'm', @{$month[0]}) if $#month != -1;
html_comments($tgt, 'y', @{$year[0]}) if $#year != -1;
print $tgt->{addhead} if defined $tgt->{addhead};
print "</HEAD>\n", $tgt->{bodytag}, "\n";
print $tgt->{pagetop} if defined $tgt->{pagetop};
unless (defined $tgt->{options}{noinfo}) {
my @st = stat $tgt->{rrd};
print "
<hr>
\nThe statistics were last updated ",
strftime("<B>%A, %d %B, %H:%M:%S %Z</B>\n",
localtime($st[9]));
}
my $dayavg = $tgt->{config}->{interval};
html_graph($tgt, 'day', 'Daily', $dayavg . ' Minute', \@day);
html_graph($tgt, 'week', 'Weekly', '30 Minute', \@week);
html_graph($tgt, 'month', 'Monthly', '2 Hour', \@month);
html_graph($tgt, 'year', 'Yearly', '1 Day', \@year);
unless (defined $tgt->{options}{nolegend}) {
print <<EOF;
<hr>
<table WIDTH=500 BORDER=0 CELLPADDING=4 CELLSPACING=0>
EOF
print <<EOF unless ($tgt->{options}{noi});
<tr>
<td ALIGN=RIGHT><font SIZE=-1 COLOR="$tgt->{col1}">
<b>$tgt->{colname1} ###</b></font></td>
<td><font SIZE=-1>$tgt->{legend1}</font></td>
</tr>
EOF
print <<EOF unless ($tgt->{options}{noo});
<tr>
<td ALIGN=RIGHT><font SIZE=-1 COLOR="$tgt->{col2}">
<b>$tgt->{colname2} ###</b></font></td>
<td><font SIZE=-1>$tgt->{legend2}</font></td>
</tr>
EOF
if ($tgt->{withpeak} ne '') {
print <<EOF unless ($tgt->{options}{noi});
<tr>
<td ALIGN=RIGHT><font SIZE=-1 COLOR="$tgt->{col3}">
<b>$tgt->{colname3} ###</b></font></td>
<td><font SIZE=-1>$tgt->{legend3}</font></td>
</tr>
EOF
print <<EOF unless ($tgt->{options}{noo});
<tr>
<td ALIGN=RIGHT><font SIZE=-1 COLOR="$tgt->{col4}">
<b>$tgt->{colname4} ###</b></font></td>
<td><font SIZE=-1>$tgt->{legend4}</font></td>
</tr>
EOF
}
print <<EOF;</table>
EOF
}
print_banner($tgt->{config})
unless defined $tgt->{options}{nobanner};
print $tgt->{pagefoot} if defined $tgt->{pagefoot};
print "\n", <<'EOF';
</body>
</html>
EOF
}
sub html_comments($$@)
{
my ($tgt, $letter, @val) = @_;
return if $#val == -1;
unless ($tgt->{options}{noi}) {
print "<!-- maxin $letter ", $val[1], " -->\n";
print "<!-- avin $letter ", $val[3], " -->\n";
print "<!-- cuin $letter ", $val[5], " -->\n";
}
unless ($tgt->{options}{noo}) {
print "<!-- maxout $letter ", $val[0], " -->\n";
print "<!-- avout $letter ", $val[2], " -->\n";
print "<!-- cuout $letter ", $val[4], " -->\n";
}
}
sub html_graph($$$$$)
{
my ($tgt, $ext, $freq, $period, $params) = @_;
return unless defined $tgt->{$ext};
my @values = @{$params->[0]};
my $x = $params->[1];
my $y = $params->[2];
$x *= $tgt->{xzoom} if defined $tgt->{xzoom};
$y *= $tgt->{yzoom} if defined $tgt->{yzoom};
my $kilo = $tgt->{kilo};
my @kmg = split(',', $tgt->{kmg});
my $fmt;
if (defined $tgt->{options}{integer}) {
$fmt = '%d';
} else {
$fmt = '%.1f';
}
my @percent = do_percent($tgt, \@values);
my @relpercent = do_relpercent($tgt, \@values);
my @nv;
for my $val (@values) {
if (@kmg == 0) { # kMG[target]: <empty>
push @nv, sprintf($fmt, $val);
next;
}
for my $si (@kmg) {
if ($val < 10000) {
push @nv, sprintf($fmt, $val) . " $si";
last;
}
$val /= $kilo;
}
}
@values = @nv;
print "
<hr>
\n<B>\`$freq\' Graph ($period Average)</B>
\n";
print '<IMG SRC="', $tgt->{url}, '-', $ext, '.' . $imagetype .
'" WIDTH=', $x, ' HEIGHT=', $y, ' ALT="', $freq,
' Graph" VSPACE=10 ALIGN=TOP>
', "\n";
print '
<TABLE CELLPADDING=0 CELLSPACING=0>';
print <<EOF if $tgt->{legendi} ne '' && !$tgt->{options}{noi};
<TR>
<TD ALIGN=RIGHT><SMALL>Max <FONT COLOR="$tgt->{col1}">$tgt->{legendi}</FONT></SMALL></TD>
<TD ALIGN=RIGHT><SMALL> $values[1]$tgt->{shortlegend}$percent[1]</SMALL></TD>
<TD WIDTH=5></TD>
<TD ALIGN=RIGHT><SMALL>Average <FONT COLOR="$tgt->{col1}">$tgt->{legendi}</FONT></SMALL></TD>
<TD ALIGN=RIGHT><SMALL> $values[3]$tgt->{shortlegend}$percent[3]</SMALL></TD>
<TD WIDTH=5></TD>
<TD ALIGN=RIGHT><SMALL>Current <FONT COLOR="$tgt->{col1}">$tgt->{legendi}</FONT></SMALL></TD>
<TD ALIGN=RIGHT><SMALL> $values[5]$tgt->{shortlegend}$percent[5]</SMALL></TD>
</TR>
EOF
print <<EOF if $tgt->{legendo} ne '' && !$tgt->{options}{noo};
<TR>
<TD ALIGN=RIGHT><SMALL>Max <FONT COLOR="$tgt->{col2}">$tgt->{legendo}</FONT></SMALL></TD>
<TD ALIGN=RIGHT><SMALL> $values[0]$tgt->{shortlegend}$percent[0]</SMALL></TD>
<TD WIDTH=5></TD>
<TD ALIGN=RIGHT><SMALL>Average <FONT COLOR="$tgt->{col2}">$tgt->{legendo}</FONT></SMALL></TD>
<TD ALIGN=RIGHT><SMALL> $values[2]$tgt->{shortlegend}$percent[2]</SMALL></TD>
<TD WIDTH=5></TD>
<TD ALIGN=RIGHT><SMALL>Current <FONT COLOR="$tgt->{col2}">$tgt->{legendo}</FONT></SMALL></TD>
<TD ALIGN=RIGHT><SMALL> $values[4]$tgt->{shortlegend}$percent[4]</SMALL></TD>
EOF
if (defined $tgt->{options}{dorelpercent}) {
print <<"EOF";
</TR>
<TR>
<TD ALIGN=RIGHT><SMALL>Max <FONT COLOR="$tgt->{col5}"> Percentage:</FONT></SMALL></TD>
<TD ALIGN=RIGHT><SMALL> $relpercent[0]</SMALL></TD>
<TD WIDTH=5></TD>
<TD ALIGN=RIGHT><SMALL>Average <FONT COLOR="$tgt->{col5}"> Percentage:</FONT></SMALL></TD>
<TD ALIGN=RIGHT><SMALL> $relpercent[1]</SMALL></TD>
<TD WIDTH=5></TD>
<TD ALIGN=RIGHT><SMALL>Current <FONT COLOR="$tgt->{col5}"> Percentage:</FONT></SMALL></TD>
<TD ALIGN=RIGHT><SMALL> $relpercent[2]</SMALL></TD>
EOF
}
print <<'EOF';
</TR>
</TABLE>
EOF
}
sub do_percent($$)
{
my ($tgt, $values) = @_;
my @percent = ('', '', '', '', '', '');
return @percent if defined $tgt->{options}{nopercent};
for my $val (0..$#$values) {
my $mx = ($val % 2 == 1) ? $tgt->{maxbytes1} : $tgt->{maxbytes2};
next unless defined $mx;
my $p = sprintf("%.1f", $values->[$val]*100/$mx);
$percent[$val] = ' (' . $p . '%)';
}
@percent;
}
sub do_relpercent($$)
{
my ($tgt, $values) = @_;
my @percent = ('', '', '');
return @percent unless defined $tgt->{options}{dorelpercent};
for my $val (0..2) {
$percent[$val] = sprintf("%.1f",
$values->[2*$val+1] * 100 / $values->[2*$val])
if $values->[2*$val] > 0;
$percent[$val] ||= 0;
$percent[$val] .= ' %';
}
@percent;
}
sub http_headers($$)
{
my ($content_type, $cfg) = @_;
print <<"EOF"; Content-Type: $content_type Refresh: $cfg->{refresh}
Pragma: no-cache
EOF
# Expires header calculation stolen from CGI.pm
print strftime("Expires: %a, %d %b %Y %H:%M:%S GMT\n",
gmtime(time+60*$cfg->{interval}));
print "\n";
}
sub do_image($$)
{
my ($target, $ext) = @_;
my $file = $target->{$ext};
return unless defined $file;
# Now the vertical rule at the end of the day
my @t = localtime(time);
$t[0] = $t[1] = $t[2] = 0;
my $seconds;
my $oldsec;
my $back;
my $xgrid;
my $unscaled;
my $withpeak;
my $noi = 1 if $target->{options}{noi};
my $noo = 1 if $target->{options}{noo};
if ($ext eq 'day') {
$seconds = timelocal(@t);
$back = 30*3600; # 30 hours
$oldsec = $seconds - 86400;
$unscaled = 1 if $target->{unscaled} =~ /d/;
$withpeak = 1 if $target->{withpeak} =~ /d/;
# We need this only for day graph. The other ones
# are magically correct.
$xgrid = 'HOUR:1:HOUR:6:HOUR:2:0:' . $percent_h;
} elsif ($ext eq 'week') {
$seconds = timelocal(@t);
$t[6] = ($t[6]+6) % 7;
$seconds -= $t[6]*86400;
$back = 8*86400; # 8 days
$oldsec = $seconds - 7*86400;
$unscaled = 1 if $target->{unscaled} =~ /w/;
$withpeak = 1 if $target->{withpeak} =~ /w/;
} elsif ($ext eq 'month') {
$t[3] = 1;
$seconds = timelocal(@t);
$back = 36*86400; # 36 days
$oldsec = $seconds - 30*86400; # FIXME (the right # of days!!)
$unscaled = 1 if $target->{unscaled} =~ /m/;
$withpeak = 1 if $target->{withpeak} =~ /m/;
} elsif ($ext eq 'year') {
$t[3] = 1;
$t[4] = 0;
$seconds = timelocal(@t);
$back = 396*86400; # 365 + 31 days
$oldsec = $seconds - 365*86400; # FIXME (the right # of days!!)
$unscaled = 1 if $target->{unscaled} =~ /y/;
$withpeak = 1 if $target->{withpeak} =~ /y/;
} else {
print_error("Unknown file extension: $ext");
}
my @local_args;
if ($unscaled) {
@local_args = ('-u', $target->{maxbytes1});
push @local_args, '--rigid' unless defined $target->{absmax};
}
if ($xgrid) {
push @local_args, '-x', $xgrid;
}
my @local_args_end;
if ($withpeak) {
push @local_args_end, 'LINE1:maxin'.$target->{col3}.':MaxIn'
unless $noi;
push @local_args_end, 'LINE1:maxout'.$target->{col4}.':MaxOut'
unless $noo;
}
my @rv = RRDs::graph($file, '-s', "-$back", @local_args,
@{$target->{args}}, "VRULE:$oldsec#ff0000",
"VRULE:$seconds#ff0000", @local_args_end);
my $rrd_error = RRDs::error;
print_error("RRDs::graph failed, $rrd_error") if defined $rrd_error;
# In array context just return the values
if (wantarray) {
if (defined $target->{factor}) {
@{$rv[0]} = map { $_ * $target->{factor} } @{$rv[0]};
}
if ($noi) {
return ([$rv[0][0], 0, $rv[0][1], 0, $rv[0][2], 0],
$rv[1], $rv[2]);
} elsif ($noo) {
return ([0, $rv[0][0], 0, $rv[0][1], 0, $rv[0][2]],
$rv[1], $rv[2]);
} else {
return @rv;
}
}
# Not in array context ==> print out the PNG file.
open PNG, "<$file" or print_error("Can't open $file: $!"); binmode PNG; http_headers("image/$imagetype", $target->{config});
my $buf;
# could be sendfile in Linux 😉
while(sysread PNG, $buf, 8192) {
print $buf;
}
close PNG;
}
sub common_args($$$)
{
my ($name, $target, $q) = @_;
return @{$target->{args}} if defined @{$target->{args}};
my $noi = 1 if $target->{options}{noi};
my $noo = 1 if $target->{options}{noo};
$target->{name} = $name;
$target->{directory} = ''
unless defined $target->{directory};
my $tdir = $target->{directory};
$tdir .= '/'
unless $tdir eq '' || $tdir =~ /\/$/;
$target->{url} = $q->url . '/' . $tdir . $name;
my $cfg = $target->{config};
my $dir = $cfg->{workdir};
$dir = $cfg->{logdir}
if defined $cfg->{logdir};
$target->{rrd} = $dir . '/' . $tdir . $name . '.rrd';
%{$target->{options}} = ()
unless defined %{$target->{options}};
$dir = $cfg->{workdir};
$dir = $cfg->{imagedir}
if defined $cfg->{imagedir};
$target->{suppress} ||= '';
$target->{day} = $dir . '/' . $tdir . $name
. '-day.' . $imagetype unless $target->{suppress} =~ /d/;
$target->{week} = $dir . '/' . $tdir . $name
. '-week.' . $imagetype unless $target->{suppress} =~ /w/;
$target->{month} = $dir . '/' . $tdir . $name
. '-month.' . $imagetype unless $target->{suppress} =~ /m/;
$target->{year} = $dir . '/' . $tdir . $name
. '-year.' . $imagetype unless $target->{suppress} =~ /y/;
$target->{maxbytes1} = $target->{maxbytes}
if defined $target->{maxbytes} && !defined $target->{maxbytes1};
$target->{maxbytes2} = $target->{maxbytes1}
if defined $target->{maxbytes1} && !defined $target->{maxbytes2};
my @args = ();
push @args, '--lazy', '-c', 'FONT#000000', '-c',
'MGRID#000000', '-c', 'FRAME#000000',
'-g', '-l', '0';
$target->{background} = '#f5f5f5'
unless defined $target->{background};
push @args, '-c', 'BACK'. $target->{background};
push @args, '-c', 'SHADEA' . $target->{background},
'-c', 'SHADEB' . $target->{background}
if defined $target->{options}{noborder};
if (defined $target->{options}{noarrow}) {
push @args, '-c', 'ARROW' . $target->{background};
} else {
push @args, '-c', 'ARROW#000000';
}
push @args, '-b', $target->{kilo}
if defined $target->{kilo};
if (defined $target->{xsize}) {
if (defined $target->{xscale}) {
push @args, '-w', $target->{xsize}*$target->{xscale};
} else {
push @args, '-w', $target->{xsize};
}
}
if (defined $target->{ysize}) {
if (defined $target->{yscale}) {
push @args, '-h', $target->{ysize}*$target->{yscale};
} else {
push @args, '-h', $target->{ysize};
}
}
my $scale = 1;
if (defined $target->{options}->{perminute}) {
$scale *= 60;
} elsif (defined $target->{options}->{perhour}) {
$scale *= 3600;
}
if (defined $target->{options}->{bits}) {
$scale *= 8;
$target->{ylegend} = 'Bits per second'
unless defined $target->{ylegend};
$target->{legend1} = 'Incoming Traffic in Bits per Second'
unless defined $target->{legend1};
$target->{legend2} = 'Outgoing Traffic in Bits per Second'
unless defined $target->{legend2};
$target->{legend3} = 'Peak Incoming Traffic in Bits per Second'
unless defined $target->{legend3};
$target->{legend4} = 'Peak Outgoing Traffic in Bits per Second'
unless defined $target->{legend4};
$target->{shortlegend} = 'b/s'
unless defined $target->{shortlegend};
} else {
$target->{ylegend} = 'Bytes per second'
unless defined $target->{ylegend};
$target->{legend1} = 'Incoming Traffic in Bytes per Second'
unless defined $target->{legend1};
$target->{legend2} = 'Outgoing Traffic in Bytes per Second'
unless defined $target->{legend2};
$target->{legend3} = 'Peak Incoming Traffic in Bytes per Second'
unless defined $target->{legend3};
$target->{legend4} = 'Peak Outgoing Traffic in Bytes per Second'
unless defined $target->{legend4};
$target->{shortlegend} = 'B/s'
unless defined $target->{shortlegend};
}
if ($scale > 1) {
push @args, "DEF:in0=$target->{rrd}:ds0:AVERAGE",
"CDEF:in=in0,$scale,*",
"DEF:maxin0=$target->{rrd}:ds0:MAX",
"CDEF:maxin=maxin0,$scale,*"
unless $noi;
push @args, "DEF:out0=$target->{rrd}:ds1:AVERAGE",
"CDEF:out=out0,$scale,*",
"DEF:maxout0=$target->{rrd}:ds1:MAX",
"CDEF:maxout=maxout0,$scale,*"
unless $noo;
} else {
push @args, "DEF:in=$target->{rrd}:ds0:AVERAGE",
"DEF:maxin=$target->{rrd}:ds0:MAX"
unless $noi;
push @args, "DEF:out=$target->{rrd}:ds1:AVERAGE",
"DEF:maxout=$target->{rrd}:ds1:MAX"
unless $noo;
}
my $i=1;
for my $coltext (split(/,/, $target->{colours})) {
my ($text, $rgb) = ($coltext =~ /^([^#]+)(#[0-9a-fA-F]{6})$/);
$target->{'col'.$i} = $rgb;
$target->{'colname'.$i} = $text;
$i++;
}
push @args, '-v', $target->{ylegend};
push @args, 'AREA:in' . $target->{col1} . ':In',
unless $noi;
push @args, 'LINE2:out' . $target->{col2} . ':Out'
unless $noo;
push @args, 'PRINT:out:MAX:%.1lf' unless $noo;
push @args, 'PRINT:in:MAX:%.1lf' unless $noi;
push @args, 'PRINT:out:AVERAGE:%.1lf' unless $noo;
push @args, 'PRINT:in:AVERAGE:%.1lf' unless $noi;
push @args, 'PRINT:out:LAST:%.1lf' unless $noo;
push @args, 'PRINT:in:LAST:%.1lf' unless $noi;
if (defined $target->{maxbytes1}) {
$target->{maxbytes1} *= $scale;
push @args, 'HRULE:' . $target->{maxbytes1} . '#cc0000';
}
if (defined $target->{maxbytes2}) {
$target->{maxbytes2} *= $scale;
push @args, 'HRULE:' . $target->{maxbytes2} . '#cccc00'
if $target->{maxbytes2} != $target->{maxbytes1};
}
@{$target->{args}} = @args;
@args;
}
sub try_read_config($)
{
my ($prefix) = (@_);
$prefix =~ s/\/[^\/]*$//;
# Verify the version of RRDtool:
if (!defined $RRDs::VERSION || $RRDs::VERSION < 1.000331) {
print_error("Please install more up-to date RRDtool - need at least 1.000331");
}
my $read_cfg;
if (!defined $config_time) {
$read_cfg = 1;
} else {
for my $file (@all_config_files) {
my @stat = stat $file;
if ($config_time < $stat[9]) { $read_cfg = 1; last; } } } return unless $read_cfg; my %defaults = ( xsize => 400,
ysize => 100,
kmg => ',k,M,G,T,P',
kilo => 1000,
bodytag => "<BODY BGCOLOR=#ffffff>\n",
colours => 'GREEN#00cc00,BLUE#0000ff,DARK GREEN#006600,MAGENTA#ff00ff,AMBER#ef9f4f',
legendi => ' In:',
legendo => ' Out:',
unscaled => '',
withpeak => '',
directory => '',
);
%targets = ();
@all_config_files = @config_files;
my $order = 0;
for my $cfgfile (@config_files) {
%{$targets{_}} = %defaults;
%{$targets{'^'}} = ();
%{$targets{'$'}} = ();
my $cfgref = {
refresh => 300,
interval => 5,
icondir => $prefix
};
read_mrtg_config($cfgfile, \%defaults, $cfgref, \$order);
}
delete $targets{'^'};
delete $targets{_};
delete $targets{'$'};
parse_directories();
$config_time = time;
}
sub read_mrtg_config($$$$);
sub read_mrtg_config($$$$)
{
my ($file, $def, $cfgref, $order) = @_;
my %defaults = %$def;
my @lines;
open(CFG, "<$file") || print_error("Cannot open config file: $!");
while (<CFG>) {
chomp; # remove newline
s/\s+$//; # remove trailing space
s/\s+/ /g; # collapse white spaces to ' '
next if /^ *\#/; # skip comment lines
next if /^\s*$/; # skip empty lines
if (/^ \S/) { # multiline options
$lines[$#lines] .= $_;
} else {
push @lines, $_;
}
}
close CFG;
foreach (@lines) {
if (/^\s*([\w\d]+)\[(\S+)\]\s*:\s*(.*)$/) {
my ($tgt, $opt, $val) = (lc($2), lc($1), $3);
unless (exists $targets{$tgt}) {
# pre-set defaults constructed on all of ^, _, and $
for my $key (%{$targets{'^'}}) {
$targets{$tgt}{$key} = $targets{'^'}{$key};
}
for my $key (%{$targets{'$'}}) {
$targets{$tgt}{$key} .= $targets{'$'}{$key};
}
# WARNING: Tobi explicitly said that when all ^, _, and $
# options are set, the result should be just the value
# of the _ option (when the option itself is not explicitly
# defined. I do not agree with him here but I respect this
# and will try to be compatible with MRTG.
for my $key (%{$targets{'_'}}) {
$targets{$tgt}{$key} = $targets{'_'}{$key};
}
# anonymous hash ref - need copy, not ref
delete $targets{$tgt}{options};
# The same as above - we need to create this
# based on [^], [_], and [$] values
%{$targets{$tgt}{options}} = ();
%{$targets{$tgt}{options}} = %{$targets{'^'}{options}}
if defined $targets{'^'}{options};
%{$targets{$tgt}{options}} = (%{$targets{$tgt}{options}},
%{$targets{'_'}{options}})
if defined $targets{'_'}{options};
%{$targets{$tgt}{options}} = (%{$targets{$tgt}{options}},
%{$targets{'$'}{options}})
if defined $targets{'$'}{options};
$targets{$tgt}{order} = ++$$order;
$targets{$tgt}{config} = $cfgref;
}
if ($tgt eq '_' && $val eq '') {
if (defined $defaults{$opt}) {
$targets{_}{$opt} = $defaults{$opt};
} else {
delete $targets{_}{$opt};
}
} elsif (($tgt eq '^' || $tgt eq '$') && $val eq '') {
delete $targets{$tgt}{$opt};
} elsif ($opt eq 'options') {
# Do not forget defaults [^] and [$]
delete $targets{$tgt}{options};
%{$targets{$tgt}{options}} = %{$targets{'^'}{options}}
if defined $targets{'^'}{options};
$val = lc($val);
map { $targets{$tgt}{options}{$_} = 1 } ($val =~ m/([a-z]+)/g);
%{$targets{$tgt}{options}} = (%{$targets{$tgt}{options}},
%{$targets{'$'}{options}})
if defined $targets{'$'}{options};
} else {
my $pre = $targets{'^'}{$opt}
if defined $targets{'^'}{$opt};
$pre ||= '';
$targets{$tgt}{$opt} = $pre.$val;
$targets{$tgt}{$opt} .= $targets{'$'}{$opt}
if defined $targets{'$'}{$opt};
}
next;
} elsif (/^Include\s*:\s*(\S*)$/) {
push @all_config_files, $1;
read_mrtg_config($1, $def, $cfgref, $order);
next;
} elsif (/^([\w\d]+)\s*:\s*(\S.*)$/) {
my ($opt, $val) = (lc($1), $2);
$cfgref->{$opt} = $val;
next;
}
print_error("Parse error in $file near $_");
}
if (defined $cfgref->{pathadd}) {
$ENV{PATH} .= ':'.$cfgref->{pathadd};
}
# if (defined $cfgref->{libadd}) {
# use lib $cfgref->{libadd}
# }
}
sub parse_directories {
%directories = ();
# FIXME: the sort is expensive
for my $name (sort { $targets{$a}{order} <=> $targets{$b}{order} } keys %targets) {
my $dir = $targets{$name}{directory}
if defined $targets{$name}{directory};
$dir = '' unless defined $dir;
my $prefix = '';
for my $component (split /\/+/, $dir) {
unless (defined $directories{$prefix.$component}) {
push (@{$directories{$prefix}{subdir}},
$component);
# For the directory, get the global parameters
# from the # config of the first item of the
# directory:
$directories{$prefix}{config} =
$targets{$name}{config};
$directories{$prefix}{bodytag} =
$targets{$name}{bodytag};
}
$prefix .= $component . '/';
}
unless (defined $directories{$dir}) {
$directories{$dir}{config} =
$targets{$name}{config};
$directories{$dir}{bodytag} =
$targets{$name}{bodytag};
}
push (@{$directories{$dir}{target}}, $name);
}
}
sub print_dir($) {
my ($dir) = @_;
my $dir1 = $dir . '/';
http_headers('text/html', $directories{$dir}{config});
print <<EOF;
<HTML>
<HEAD>
<TITLE>MRTG: Directory $dir1</TITLE>
</HEAD>
EOF
print $directories{$dir}{bodytag};
my $subdirs_printed;
if (defined @{$directories{$dir}{subdir}}) {
$subdirs_printed = 1;
print <<EOF;
<H1>MRTG subdirectories in the directory $dir1</H1>
<UL>
EOF
for my $item (@{$directories{$dir}{subdir}}) {
print "
<LI><A HREF=\"$item/\">$item/</A>\n";
}
print "</UL>
\n";
}
if (defined @{$directories{$dir}{target}}) {
print "
<hr>
\n" if defined $subdirs_printed;
print <<EOF;
<H1>MRTG graphs in the directory $dir1</H1>
<TABLE BORDER=0 WIDTH=100%>
EOF
my $odd;
for my $item (@{$directories{$dir}{target}}) {
my $itemname = $item;
$itemname = $targets{$item}{title}
if defined $targets{$item}{title};
print "
<TR>\n" unless $odd;
print <<EOF;
<TD><A HREF="$item.html">$itemname
<IMG SRC="$item-day.$imagetype" BORDER=0 ALIGN=TOP VSPACE=10 ALT="$item">
</A><BR CLEAR=ALL>
</TD>
EOF
print " </TR>
\n" if $odd;
$odd = !$odd;
}
print " </TR>
\n</TABLE>
\n";
}
print_banner($directories{$dir}{config});
print "</BODY>\n</HTML>\n";
}
sub print_banner($) {
my $cfg = shift;
print <<EOF;
<hr>
<table BORDER=0 CELLSPACING=0 CELLPADDING=0>
<tr>
<td WIDTH=63><a ALT="MRTG" HREF="http://ee-staff.ethz.ch/~oetiker/webtools/mrtg/mrtg.html"><img BORDER=0 SRC="$cfg->{icondir}/mrtg-l.$imagetype"></a></td>
<td WIDTH=25><a ALT="" HREF="http://ee-staff.ethz.ch/~oetiker/webtools/mrtg/mrtg.html"><img BORDER=0 SRC="$cfg->{icondir}/mrtg-m.$imagetype"></a></td>
<td WIDTH=388><a ALT="" HREF="http://ee-staff.ethz.ch/~oetiker/webtools/mrtg/mrtg.html"><img BORDER=0 SRC="$cfg->{icondir}/mrtg-r.$imagetype"></a></td>
</tr>
</table>
<spacer TYPE=VERTICAL SIZE=4>
<table BORDER=0 CELLSPACING=0 CELLPADDING=0 WIDTH=476>
<tr VALIGN=top>
<td ALIGN=LEFT><font FACE="Arial,Helvetica" SIZE=2>
version 2.9.17</font></td>
<td ALIGN=RIGHT><font FACE="Arial,Helvetica" SIZE=2>
<a HREF="http://ee-staff.ethz.ch/~oetiker/">Tobias Oetiker</a>
<a HREF="mailto:oetiker\@ee.ethz.ch"><oetiker\@ee.ethz.ch></a>
</font></td>
</tr>
<tr>
<td></td>
<td ALIGN=RIGHT><font FACE="Arial,Helvetica" SIZE=2>
and <a HREF="http://www.bungi.com">Dave Rand</a> <a HREF="mailto:dlr\@bungi.com"><dlr\@bungi.com></a></font></td>
<tr VALIGN=top>
<td ALIGN=LEFT><font FACE="Arial,Helvetica" SIZE=2>
<A HREF=http://www.fi.muni.cz/~kas/mrtg-rrd/>mrtg-rrd.cgi version $version</A>
</font></td>
<td ALIGN=RIGHT><font FACE="Arial,Helvetica" SIZE=2>
<A HREF="http://www.fi.muni.cz/~kas/">Jan "Yenya" Kasprzak</A>
<A HREF="mailto:kas\@fi.muni.cz"><kas\@fi.muni.cz></A>
</font></td>
</tr>
</table>
EOF
print '<!--$Id: mrtg-rrd.cgi,v 1.35 2003/08/18 15:58:57 kas Exp $-->', "\n";
}
sub dump_targets() {
for my $tgt (keys %targets) {
print "Target $tgt:\n";
for my $opt (keys %{$targets{$tgt}}) {
if ($opt eq 'options') {
print "\toptions: ";
for my $o1 (keys %{$targets{$tgt}{options}}) {
print $o1, ",";
}
print "\n";
next;
}
print "\t$opt: ", $targets{$tgt}{$opt}, "\n";
}
}
}
sub dump_directories {
print "Directories:\n";
for my $dir (keys %directories) {
print "Directory $dir:\n";
for my $item (@{$directories{$dir}}) {
print "\t$item\n";
}
}
}
sub print_error(@)
{
print "Content-Type: text/plain\n\nError: ", join(' ', @_), "\n";
exit 0;
}
#--BEGIN CGI--
#For CGI, use this:
use CGI;
my $q = new CGI;
# thttpd fix up by Akihiro Sagawa
if ($q->server_software() =~ m|^thttpd/|) {
my $path = $q->path_info();
$path .= '/' if ($q->script_name=~ m|/$|);
$q->path_info($path);
}
handler($q);
#--END CGI--
#--BEGIN FCGI--
# For FastCGI, uncomment this and comment out the above:
#-# use FCGI;
#-# use CGI;
#-#
#-# my $req = FCGI::Request();
#-#
#-# while ($req->Accept >= 0) {
#-# my $q = new CGI;
#-#
#-# # thttpd fix up by Akihiro Sagawa
#-# if ($q->server_software() =~ m|^thttpd/|) {
#-# my $path = $q->path_info();
#-# $path .= '/' if ($q->script_name=~ m|/$|);
#-# $q->path_info($path);
#-# }
#-#
#-# handler($q);
#-# }
#--END FCGI--
1;
Few Tips
Make sure you install rrdtool before using it 🙂
apt-get -y install rrdtool
To execute MRTG with command manually
env LANG=C mrtg /etc/mrtg.cfg
To assign apache www-data users full rights to /var/www/mrtg folder
chown -R www-data /var/www/mrtg/
SNMPWALK sample command to query any OID from snmp enabled target machine
snmpwalk -v1 -c gt 10.0.0.1 .1.3.6.1.2.1.25.2.3.1.6.65536
CFGMAKER command to create interface commands (this will support acquiring data larget then 120 M limit) as explained here. ( https://aacable.wordpress.com/tag/mrtg-120m-limit/ )
cfgmaker public@10.0.0.1:::::2 > temp.cfg
MRTG crontab sample (1 minute interval when using RRD)
*/1 * * * * env LANG=C mrtg /etc/mrtg.cfg –logging /var/log/mrtg.log
Enable CGI
sudo a2enmod cgi
Can’t locate RRDs.pm in @INC
SOLUTION:
sudo apt-get install librrds-perl
Some Sample Outputs !
WAN Usage: [Below …]

Noc Room Temperature

Disk Space Used in Percent %

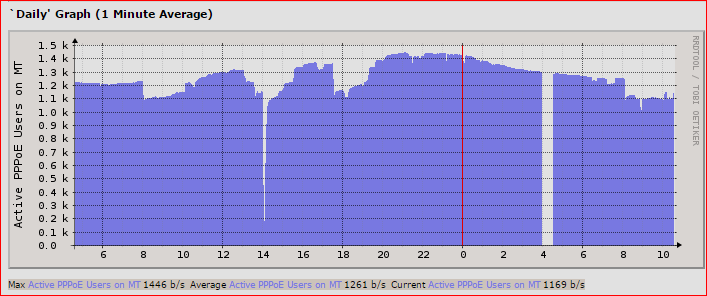
Active PPP Users on CCR_1036
CPU Usage of CCR_1036

PING to Google DNS via CCR_1036

Memory Usage of CCR_1036

RB Temperature of CCR_1036

RB Voltage history of CCR_1036

SERVER UPTIME

Memory Usage of Linux System

Regard’s
~ Syed Jahanza!B ~


