MIKROTIK DUDE BASIC INSTALLATION GUIDE, yes only basic 🙂 ~ Article by Syed Jahanzaib ~CNMS - Centralized Network Monitoring & Management System !!! - JZ

Example MAP of my Office LAN
NOTE: Be careful, Dude on router has a big impact on the router CPU resources. It is best to use it on a separate windows base system for more customized control.
What is THE DUDE ?
Answer is below > As Mikrotik Wiki defines:
The Dude is a free Monitoring application by MikroTik, which can dramatically improve the way you manage/monitor your network environment.
It will automatically scan all devices within specified subnets, Draw and Layout a map of your networks, monitor services of your devices and execute actions based on device state changes.
Some customized probes used in this map:
- Voice / Speak Alert on various target / devices down/up events
- NOC Room temperature (It alerts when temperature goes above 25)
- Vmware ESXi 4.0/5.0 Guest VM + windows/linux servers Power ON/Shutdown from Dude using Tool Menu with customized scripts *
- UPS Load / Voltages / UPS Internal Temperature
- IBM Lotus Number of Mail Waiting / DB Connected Users / Availability Index
- HP Printers Toner Remaining in %
- No. of Connected Users on each A.P
- Disk Free/Total Statics, Alerts when Specified partition goes above 90%
- Disk Read/Write Monitoring / Alert
- High Memory Monitoring Alert
- Windows Service Monitor on SAP Servers
- Cisco ASA / Switches CPU Load/ Up-time / Temperature
- Cisco Access Point Active Connected Users
- Alerts for Lotus Domino / SAP Servrs Service alert , for example if server is on but specific service is down
- Wireless Link Usage Monitoring
- Internet / LAN Link Monitor, If the link is in full utilization i.e 4mb, the link color changes to Orange, indicating Load on the link. very useful to monitor load.
Mikrotik’s “The DUDE” LIVE Monitoring System , It shows Live View of all devices and server’s on screen, Auto Refreshes at defined intervals,
GREEN icon shows target is Active & Healthy,
ORANGE shows one or more probes failed to poll query any specific counter/oid,
RED means the target device is not reachable via network or powered off.
With some my of my Customized Advance Monitoring Probes Like UPS Temperature, KESC Voltages IN , NOC Room Temperature, HDD Monitor, I have also made some Custom Alerts, For Example if NOC Room Temperature Goes above 25 Degree, It will show Visual Alert, Email or SMS. or if D: drive space on mail server goes above 80% it will alert me, If a targeted service on specific server stop, it visually alerts. Voice Speak Alert for various counters.
Very good and advance Monitoring System, It can Shutdown and POWER ON any system on MAP using tools and custom scripts, Also I have added some customize tools/scripts to run on target device using custom command , added in tool menu.
We call it CNMS, Centralized Network Monitoring System
Thanks to DUDE ![]()
You can Install the DUDE on your Windows PC , OR you can also install it on your Mikrotik x86/RouterBoard.
First Download ‘The Dude’ from
http://www.mikrotik.com/thedude.phpDownload the ‘Dude 4.0 beta 3′ for Windows
<a href="https://drive.google.com/drive/folders/0B8B_P2ljEc2xeHVYRVIxQWx6UTg">https://drive.google.com/drive/folders/0B8B_P2ljEc2xeHVYRVIxQWx6UTghttp://download.mikrotik.com/dude-install-3.6.exe</a>After download simply execute the .exe file and it will install it just like any other simple application.If you have install it on PC, you can start by going to START / Programs / The due.
Once installation is done, You can start by going to START / Programs / The due
Ok execute the dude. You will be asked for the credentials, Just like Mikrotik default installation, dude have no default password
- ID = admin
- Password = No Password, Just Enter

Now you will The Dude main screen. Just for an example, I will add simple Network by using Auto DISCOVERY. You can later create your own desired network MAP once you understand HOW things works in dude.

Use your local subnet series. Also click on ‘LAYOUT MAP AFTER DISCOVERY COMPLETE’.
Remove un-necessary services from SERVICES menu, so you will not get red icon if the services not found.
Its best to install SNMP on all of your servers to get the maximum information like Link usage/CPU/Memory/HDD etc etc.

After it will completes the discovery, it will create a automatic layout map, Something similar to below image.

If you are unable to see any PC , Try adding few ips manually. If target pc ping/icmp is blocked, then you won’t be able to see any PC in the graphs, so its better to use another approach /combination on “Device name preferences”. Also check your mikrotik / target pc firewall configuration.
The above image looks Pretty much messed up, but you can trim it or adjust it according to your flavor :), like the below

The DUDE tip’s n tricks 🙂
Howto ADD Machines/Devices Manually (Without Auto Discovery Mode)
Sometimes You would like to add only few targeted devices / computers on your network to be monitored via dude.
To do so follow the instructions showed in the below screenshots.
On the Network MAP screen, Click on + sign, then select Device. Now enter IP address of your target device and click NEXT.

Now select DISCOVER to check what services target device is offering for monitoring.

Now add another device as shown in above images.
Now add Network ICON so that we can connect both devices for link monitoring.

Now the real part, Again Click on + sign and click LINK to create link between device and network icon.


Howto Change Background Image
You can change background image by going to

HOWTO ENABLE WEB BASE ACCESS
You can also View/Controll Dude via web browser. This is convenient if you have fix public ip on your mikrotik / pc where due is hosted, you can monitor your network all over globe using browser only.
First you have to enable Web Service in DUDE.

Make sure there is no other web server running on your pc/mikrotik. If so, please change the port in above image to something different , example 1234. Now open your browser and point it to your dude server.
[sourcode]
[/sourcecode]
It will ask id password, Enter your credentials. (First time dude installation have no password, just enter use admin without any password, and then you can change password from ADMIN section.
Now click on MAPS > Network Map & you will be redirected to your network map. See the below image.


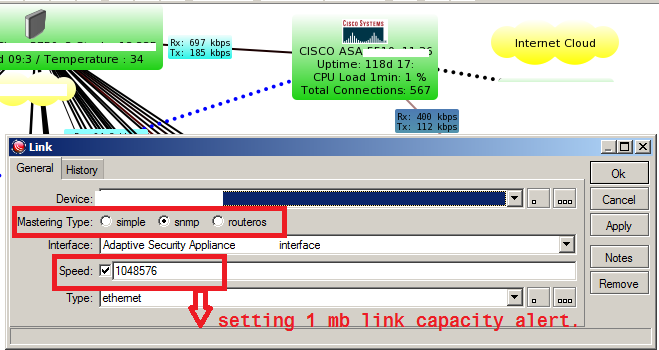
HOWTO Show Link Capacity with color changing on full usage
If you want to monitor link bandwidth usage, and you want to configure that if the link is used fully its color should be changed as showed in the image below . . .

.
take properties of link , and tick on ‘speed’ and define the value you want to monitor. for example 1mb
as showed in the image below.
HOWTO Show any OID on Device
Some of the examples are taken from the Mikrotik DUDE forum.
Special thanks to Mr. Lebowski
Right click on your device and select APPEARANCE, click on LABEL: and add this OID (For example only, change the OID as your requirement)
NOC Room Temperature : [oid("1.3.6.1.4.1.534.1.6.5.0")]OR
if you want to divide the value to be displayed, use following formula
Temperature: [oid("1.3.6.1.4.1.13400.2.62.2.1.2.0")/100]
Show Windows Disk Space on Label
To display Disk space on LABEL, first look for that particular partition OID, & then change it in below code, (my G: drive partition OID is 5, your’s may vary)
TIP:
Then use the below code on LABEL, (Right click on your dude target, and take APPEARANCE option and paste the code in LABEL section]
[Device.Name] [device_performance()][Device.ServicesDown] Disk [Free/Total] G:\=[round(((((oid("1.3.6.1.2.1.25.2.3.1.5.5")-oid("1.3.6.1.2.1.25.2.3.1.6.5"))*oid("1.3.6.1.2.1.25.2.3.1.4.5"))/1024)/1024)/1024)]/[round(((oid("1.3.6.1.2.1.25.2.3.1.5.5")*oid("1.3.6.1.2.1.25.2.3.1.4.5")/1024)/1024)/1024)] GB Uptime: [string_substring(oid("1.3.6.1.2.1.1.3.0"),0,8)]
MIKROTIK OIDS FOR DISPLAY
[Device.Name] Uptime: [string_substring(oid("1.3.6.1.2.1.1.3.0"),0,8)] [device_performance()][Device.ServicesDown] Active PPP users: [oid("1.3.6.1.4.1.9.9.150.1.1.1.0")] Voltage: [oid("1.3.6.1.4.1.14988.1.1.3.8.0")/10] V / Temperature: [oid("1.3.6.1.4.1.14988.1.1.3.10.0")/10] C Processor-Temp: [oid("1.3.6.1.4.1.14988.1.1.3.11.0")/10] C Power-Consumption: [oid("1.3.6.1.4.1.14988.1.1.3.12.0")/10] WResult:
HOWTO Remote Shutdown any PC using DUDE Tools (generally for AD environment)
Open Dude console, from left menu, goto tools, and click on plus sign + to add new tool,the following
Type: Executable Name: Shutdown Target: c:\windows\system32\shutdown.exe -s -f -t 30 /m \\[Device.FirstAddress]I will add more snaps and info of some live networks where I deployed this beautiful tool.
One Link:
https://aacable.wordpress.com/2012/07/02/the-dude-show-us-your-map-series/
HOWTO add probe for disk like C: & D:
To monitor C: or D: drive for space alert, First create Function, then create probe and use the function. then add this probe to device 🙂
Function. Name: drivec Code :if(array_size(oid_column(1.3.6.1.2.1.25.2.3.1.6,10,5)),round((oid(1.3.6.1.2.1.25.2.3.1.6.1,10,5)/oid(1.3.6.1.2.1.25.2.3.1.5.1,10,5))*100),False)Now create new Probe.
Name:Low Space in C Drive Type: Function Available:drivec()False Error:if(drivec()False,if(drivec() < 85, , concatenate(Warning: Drive C = , drivec(), %)), Failed to read Drive C the server might be down) Value:drivec() Unit: %Now add this probe in target windows device in service section. That’s it. Now if the C: Drive goes above 85%, it will alert, you can tag voice/visual/email/sms alert with it. I use VOICE alert 😀
NOTE: The OID for the C: drive can be different on your system , it depends on the drives you have in your system, for example I used the 1.3.6.1.2.1.25.2.3.1.6.1 , but you may have 1.3.6.1.2.1.25.2.3.1.6.2 , so its better to check it in snmp section of device properties.
HOWTO show Disk Read & Write Time
You have to first install snmptools and add disk counters in the ini file in order to retrieve the disk read write time counters.e.g: https://aacable.wordpress.com/2012/07/25/using-snmptools-to-monitor-disk-read-write-time-win2008-6432-bit/
Disk Read / Write Time C: & D: [string_substring(oid(“1.3.6.1.4.1.15.1”),0,3)] / [string_substring(oid(“1.3.6.1.4.1.15.2”),0,3)]
HOWTO check if specific program is running or not [using taskmgr list]
Create New FUNCTION and tag it with your required target device.
Probe Name: lotus_notes_test Type: Function Available: if(array_find(oid_column("1.3.6.1.2.1.25.4.2.1.2"), "nserver.exe")>0, 1, -1) Error: if(array_find(oid_column("1.3.6.1.2.1.25.4.2.1.2"), "nserver.exe")>0, "", "Domino Service not Running") Value: 1 Unit: runningNote: Replace notes2.exe with your require file’s name you want to monitor. The name is case-sensitive! Write the full file name the same as you see it in the Windows Task Manager List.
HOWTO check if specific SERVICE is running or not
Create New Probe and tag it with your required target device.
Probe Name: check_telnet_service Type: Function Available: if(array_find(oid_column("1.3.6.1.4.1.77.1.2.3.1.1"),"Telnet")0, 1, 0) Error: if(array_find(oid_column("1.3.6.1.4.1.77.1.2.3.1.1"),"Telnet")0, "", "Telnet not detected by SNMP probe") Value: 1 Unit:Note: Replace Telnet with the service name your want to monitor. Type the full name of the service you see in the services console. The name may be case-sensitive! Write the file name the same as you see it in the Services Console.
HOWTO Create Alert if specific OID result gets below Specific Digit/% like NOC room temperature
If you want to monitor specific OID result and if it gets below or above your pre-defined number, it should alert, Use the below probe (I used this probe to monitor my data center room temperature using temperature device, if the temperature goes above 25, it alerts using sms/voice alert)
Name: NOC Room Temperature Alert Type: Function Available: if(oid("1.3.6.1.4.1.534.1.6.5.0")0, 1, -1) Available: if(oid("1.3.6.1.4.1.534.1.6.5.0")25, "", "NOC Room Temp Over 25 / SJz") Value: 1.3.6.1.4.1.534.1.6.5.0 Unit: Cand if you want to divide the snmp result by 100 , then you have to first create function like following.
then create a probe with following data.
Name: NOC Room Temp Type Function: Agent: Default Available: getTemperature() Error: if(getTemperature()<25, "", "NOC Room Temperature above 25 c, Please check A.C") Value: getTemperature() Unit: C
HOWTO show ping result on device label
If you want to show the ping result on your device label, Right click on device , select appearance, in Lablel, paste the following code:
[array_element(ping(device_property(“FirstAddress”)),0)] ms
HOWTO Check for High Delay via Ping Function/Probe
If you want to monitor any device ping delay ms, for example if ping ms delay to any internet link increases above 600 ms , then it should alert, use the following function/probe.
First add new function
Function: Name: ping_rtt Description: Returns the round-trip time of a ping request to the FirstAddres of a device Code: round(array_element(ping(device_property("FirstAddress")), 0))Now create probe and tag the ping_rtt function in it.
Probe Name: Ping Delay Type: Function Available: and(device_property("FirstAddress") "", ping_rtt()>-1) Error: if(and(ping_rtt()>-1, ping_rtt()-1, concatenate("Latency above 200ms with ", ping_rtt(), "ms"), "down")) Value: ping_rtt() Unit: msNow tag it with the device in services section.
HOWTO check HP 2420n Toner Cartridge
On device label, use the following oid [Make sure you have enabled the snmp on the printer and in the device snmp section)
TONER [oid("1.3.6.1.2.1.43.11.1.1.9.1.1")/0.6000*100] % Remaining
HOWTO show number of connected users on Cisco AP
Active WiFi Users: [oid("1.3.6.1.4.1.9.9.273.1.1.2.1.1.1")]
HOWTO show number of PPP ACTIVE users on Mikrotik RouterOS
Active PPP Users: [oid("1.3.6.1.4.1.9.9.150.1.1.1.0")]
HOWTO show Disk C: & D: Free/Total statistics on Device Lable
Disk [Free/Total] C:\=[round(((((oid("1.3.6.1.2.1.25.2.3.1.5.1")-oid("1.3.6.1.2.1.25.2.3.1.6.1"))*oid("1.3.6.1.2.1.25.2.3.1.4.1"))/1024)/1024)/1024)]/[round(((oid("1.3.6.1.2.1.25.2.3.1.5.1")*oid("1.3.6.1.2.1.25.2.3.1.4.1")/1024)/1024)/1024)] GB
HOWTO show Cisco ASA 5510 Cpu Usage & Connections
Cisco ASA Cpu Usage: CPU Load 1min: [oid("1.3.6.1.4.1.9.9.109.1.1.1.1.5.1")] % Total Connections: [oid("1.3.6.1.4.1.9.9.147.1.2.2.2.1.5.40.6")]
HOWTO show Cisco 3750 CPU USAGE
Cisco 3750 switch Cpu Usage LAST 5 SEC AVG : [oid("1.3.6.1.4.1.9.2.1.56.0")] Cisco 3750 switch Cpu Usage LAST 1 MNT AVG : [oid("1.3.6.1.4.1.9.2.1.57.0")] Cisco 3750 switch Cpu Usage LAST 5 MNT AVG : [oid("1.3.6.1.4.1.9.2.1.58.0")]
HOWTO show Cisco 3750 Switch Temperature
Temperature : [oid("1.3.6.1.4.1.9.9.13.1.3.1.3.1006")]
HOWTO show EATON UPS 9155 : Temperature/Volts/Load
UPS Temp: [oid("1.3.6.1.4.1.534.1.6.1.0")] Volts: [oid("1.3.6.1.2.1.33.1.3.3.1.3.1")] LOAD [oid("1.3.6.1.2.1.33.1.4.4.1.5.1")] % Backup Time Remaining: [oid("1.3.6.1.2.1.33.1.2.3.0")]
EATON Powerware Environment Monitoring Probe [EMP]
NOC Room Temperature : [oid("1.3.6.1.4.1.534.1.6.5.0")] NOC Room Humidity : [oid("1.3.6.1.4.1.534.1.6.6.0")]
EMERSON LIBERT 10kva UPS Monitoring Probe [EMP]
INPUT Volt: [oid("1.3.6.1.4.1.13400.2.16.2.2.1.0")/100] LOAD [oid("1.3.6.1.4.1.13400.2.16.2.3.6.0")/100] % Battery Volt [oid("1.3.6.1.4.1.13400.2.16.2.5.1.0")/100] Backup Time: [oid("1.3.6.1.4.1.13400.2.16.2.5.2.0")] # Temperature & Humidity are not builtin feature, separate sensor module should be attached with the UPS like IRM-S02TH Temperature: [oid("1.3.6.1.4.1.13400.2.62.2.1.2.0")/100] Humidity: [oid("1.3.6.1.4.1.13400.2.62.2.1.3.0")/100]
HOWTO show all CPU’s Load
Load on [array_size(oid_column("iso.org.dod.internet.mgmt.mib-2.host.hrDevice.hrProcessorTable.hrProcessorEntry.hrProcessorLoad"))] CPU('s): [oid_column("iso.org.dod.internet.mgmt.mib-2.host.hrDevice.hrProcessorTable.hrProcessorEntry.hrProcessorLoad")]
Howto add MYSQL or any service probe
IBM Lotus Domino Server
Mail Waiting: [oid("1.3.6.1.4.1.334.72.1.1.4.6.0")] Server Availability Index: [oid("1.3.6.1.4.1.334.72.1.1.6.3.19.0")] Lotus DB Connected Users: [oid("1.3.6.1.4.1.334.72.1.1.6.3.6.0")]
Howto Show System/Device UPTIME
Uptime: [string_substring(oid("1.3.6.1.2.1.1.3.0"),0,8)]
Howto Send SMS alerts via DUDE.
https://aacable.wordpress.com/2013/11/02/mikrotik-dude-sms-notification/
Howto Show Cisco SG300/SG500 CPU Load
CPU: [oid("1.3.6.1.4.1.9.6.1.101.1.7.0")]
Windows Server DHCP Information
[Device.Name] [device_performance()][Device.ServicesDown]Uptime: [string_substring(oid("1.3.6.1.2.1.1.3.0"),0,9)] DHCP Used IPs : [oid("iso.3.6.1.4.1.311.1.3.2.1.1.2.101.0.0.0")] DHCP Left IPs : [oid("iso.3.6.1.4.1.311.1.3.2.1.1.3.101.0.0.0")]
Windows High Memory Usage Function
Add new PROBE
Name: Memory Usage Above 80% Type Function: Agent: Default Available: if(mem_usage()>0, 1, -1) Error: if(mem_usage() 80%") Value: mem_usage() Unit: %
APC SMARTUPS 1500 Series with APC Web/SNMP Management Card
General
UPS Type .1.3.6.1.4.1.318.1.1.1.1.1.1.0
String containing UPS model, eg: Smart-UPS 1000
Battery Information
Battery capacity .1.3.6.1.4.1.318.1.1.1.2.2.1.0
Battery capacity as % of total
Battery temperature .1.3.6.1.4.1.318.1.1.1.2.2.2.0
Battery temperature in Celcius of Farenheit – depending on how UPS is configured
Battery runtime remain .1.3.6.1.4.1.318.1.1.1.2.2.3.0
Total battery runtime available based on current load.
Battery replace .1.3.6.1.4.1.318.1.1.1.2.2.4.0
If result = 2 then battery needs replacing (1 = ok)
UPS Input
Input voltage .1.3.6.1.4.1.318.1.1.1.3.2.1.0
Input voltage, to the UPS device
Input frequency .1.3.6.1.4.1.318.1.1.1.3.2.4.0
Input frequency in Hz
Reason for last transfer .1.3.6.1.4.1.318.1.1.1.3.2.5.0
String containing reason for last transfer to battery power
1 No events
2 High line voltage
3 Brownout
4 Loss of mains power
5 Small temporary power drop
6 Large temporary power drop
7 Small spike
8 Large spike
9 UPS self test
10 Excessive input voltage fluctuationUPS Output
Output voltage .1.3.6.1.4.1.318.1.1.1.4.2.1.0
Output voltage from the UPS
Output frequency .1.3.6.1.4.1.318.1.1.1.4.2.2.0
Output frequency in Hz
Output load .1.3.6.1.4.1.318.1.1.1.4.2.3.0
Output load expressed as % of capacity
Output current .1.3.6.1.4.1.318.1.1.1.4.2.4.0
Output current in Amps
Diagnostics
Comms .1.3.6.1.4.1.318.1.1.1.8.1.0
Whether SNMP agent is communicating with UPS device 1 = yes, 2 = no
Last Self Test result .1.3.6.1.4.1.318.1.1.1.7.2.3.0
Result of last self test as text string. eg: pass or fail.
Last Self Test date .1.3.6.1.4.1.318.1.1.1.7.2.4.0
Date of last self test
Notes on DUDE polling section
Default settings are 30 seconds for poll interval, 10 seconds for timeout, and downcount of 5.
The Dude (as well as most active monitoring systems) actively polls (queries) the devices that it is managing. This poll typically is a standard ICMP ping to determine if the device is still alive on the network. It can also be other things such as a check of a telnet, ssh, or http port. The poll interval is how often does it query (ping) a specific device. Default is 30 seconds, therefore The Dude will ping each device once every 30 seconds.
The timeout parameter is how long The Dude waits for a reply from a ping or check of a telnet, ssh, or http port before considering it a failed response.
The downcount parameter is how many failed responses are required before The Dude declares the device as a failed device.
Default situation is 30 second poll interval with 10 seconds timeout and downcount of 5. Therefore, you would have 5 polls at 30 second intervals plus 10 seconds would need to be failed before you see a declaration of a failed device (2 minutes and 40 seconds).
These parameters are adjustable because with a larger network you want to increase the poll interval to reduce network traffic from the monitoring system. The Dude however allows you to set the poll interval/timeout/downcount individually for each device. This way you can set a value that is good for your individual network as the default and then set values that are significantly smaller for high priority devices such as the company’s main database server.
☺
Regard’s
~ Syed Jahanzaib ~


